

Deere & Co Stock (DE) Moved Down by 3.04% on May 15: What Investors Need To Know

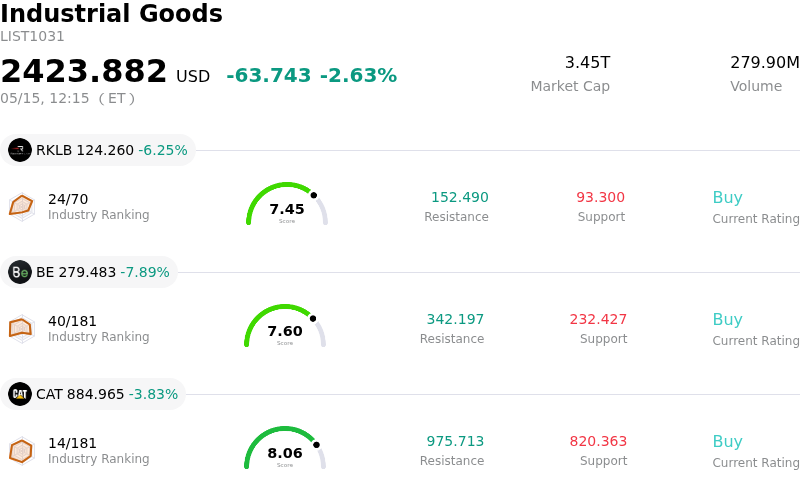
Deere & Co (DE) moved down by 3.04%. The Industrial Goods sector is down by 2.63%. The company underperformed the industry. Top 3 stocks by turnover in the sector: Rocket Lab USA Inc (RKLB) down 6.25%; Bloom Energy Corp (BE) down 7.89%; Caterpillar Inc (CAT) down 3.83%.
What is driving Deere & Co (DE)’s stock price down today?
Deere & Company's stock experienced a decline today, reflecting investor concerns stemming from several factors impacting its near-term financial outlook and the broader agricultural market. A significant driver appears to be the anticipation of the company's second-quarter 2026 earnings report, scheduled for release next week. Analysts are largely forecasting a year-over-year decrease in earnings per share for the upcoming quarter, despite expectations of higher revenues. This projected profit contraction, particularly within the critical Production & Precision Agriculture segment, is weighing on market sentiment.
The broader agricultural equipment industry faces mixed demand signals and challenging macroeconomic conditions. Farmers are grappling with pressure from low commodity prices and elevated input costs, which is leading to cautious capital expenditure on new machinery. The company has previously indicated that 2026 is expected to mark the bottom of the large agricultural cycle, suggesting a lack of immediate recovery in this key segment. Furthermore, an oversupply of certain crops from the previous year is contributing to lower commodity prices and impacting farmer profitability. Expectations for farm income in 2026 are also for weaker returns due to rising input costs, potentially influenced by geopolitical factors.
Ongoing tariff costs represent another headwind for Deere, impacting operating profit and contributing to margin pressures. While the long-term outlook for the agricultural equipment market is generally positive, driven by mechanization and smart farming, the immediate period is characterized by uncertainty. The combination of anticipated lower earnings, a subdued agricultural market cycle, and persistent cost pressures likely contributed to the stock's negative movement during today's trading session.
Technical Analysis of Deere & Co (DE)
Technically, Deere & Co (DE) shows a MACD (12,26,9) value of [-0.83], indicating a neutral signal. The RSI at 47.17 suggests neutral condition and the Williams %R at -53.94 suggests oversold condition. Please monitor closely.
Fundamental Analysis of Deere & Co (DE)
Deere & Co (DE) is in the Industrial Goods industry. Its latest annual revenue is $45.67B, ranking 2 in the industry. The net profit is $5.03B, ranking 2 in the industry. Company Profile
Over the past month, multiple analysts have rated the company as Buy, with an average price target of $653.65, a high of $793.00, and a low of $471.00.
More details about Deere & Co (DE)
Company Specific Risks:
- Potential for Q2 2026 earnings per share (EPS) to fall below analyst consensus, given expectations for a year-over-year decline in EPS despite anticipated revenue growth, indicating possible margin pressures.
- Continued softness in the Production and Precision Agriculture (PPA) segment, a major contributor to sales and profits, with net sales projected to decline year-over-year by 5% to 10%, posing a risk to overall profitability.
- Persistent negative impact from tariffs and weak demand in the South American market, which previously contributed to a significant year-over-year net income decrease, creating uncertainty for future financial performance.
- Bearish technical indicators, including the stock trading below its 50-day moving average and a bearish cross of the 10-day below the 50-day moving average, suggest a potential shift towards a sustained downward trend for the stock.
This article may include AI-generated content that is human-reviewed, which is for reference and general information purposes only and does not constitute investment advice.
Recommended Articles


Comments (0)
Click the $ button, enter the symbol, and select to link a stock, ETF, or other ticker.