

Silver Price Forecast: XAG/USD remains range-bound with RSI and MACD signaling weak momentum

- Silver remains range-bound as lingering uncertainty over a potential US-Iran agreement keeps traders on the sidelines.
- Hawkish Fed expectations linked to rising Oil-driven inflation concerns continue to cap Silver’s upside.
- XAG/USD remains capped below the 20-day Bollinger SMA as soft momentum indicators maintain a bearish near-term bias.
Silver (XAG/USD) remains range-bound on Friday as traders avoid aggressive positioning amid uncertainty surrounding US-Iran negotiations. At the time of writing, the white metal trades near $76.00 and is likely to close the week on a flat note.
In the latest developments, Iran’s Foreign Ministry spokesperson said, “We cannot necessarily say that we have reached a point where an agreement is close,” according to Tasnim News Agency. The spokesperson also said, “Details related to the nuclear issue are not being discussed at this stage,” according to Islamic Republic News Agency (IRNA), adding, “We will not reach a conclusion if we try to delve into details related to highly enriched uranium in Iran.”
Separately, sources told Sky News Arabia that negotiations in Tehran have reached an understanding on broad lines regarding the nuclear file.
Curbing Iran’s nuclear ambitions remains one of Washington’s key demands for reaching an agreement, and the latest comments highlight that major differences between both sides still remain, keeping traders skeptical over whether a final deal can be reached.
Following the fresh headlines, the US Dollar eases from intraday highs, though XAG/USD struggles to attract meaningful buying interest as hawkish Fed expectations continue to limit the upside.
Inflation concerns linked to elevated Oil prices have prompted traders to increasingly price in the possibility of a Fed rate hike by the end of the year, with the latest University of Michigan (UoM) inflation expectations data further reinforcing that view.
Technical Analysis:
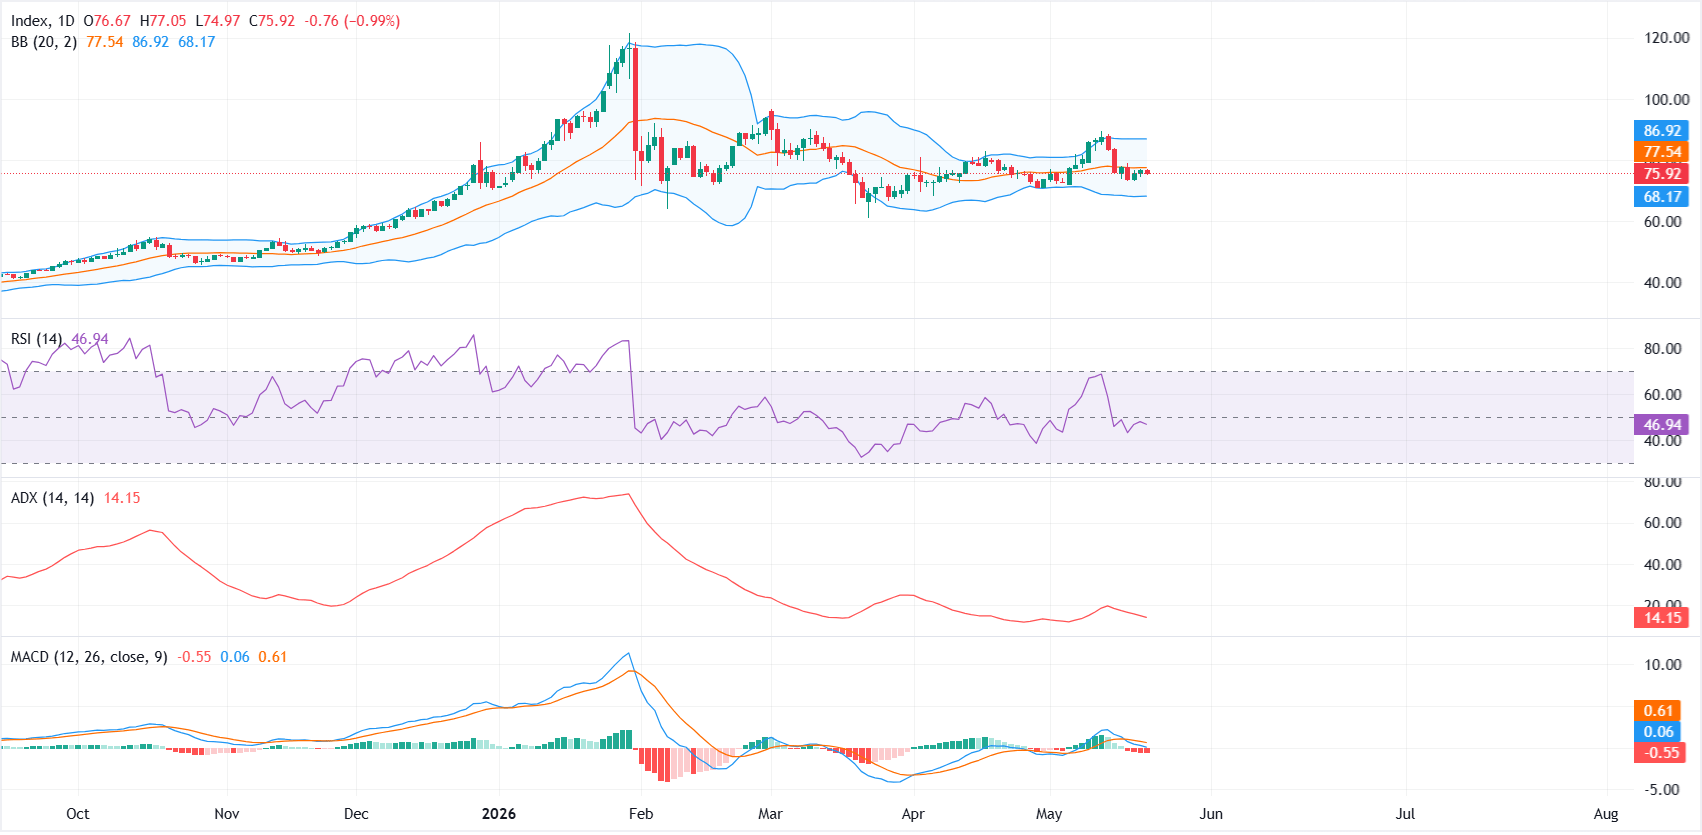
On the daily chart, XAG/USD holds below the 20-day Bollinger Simple Moving Average at roughly $77.54, keeping the near-term bias bearish despite price stabilizing after the recent slide. Momentum readings are soft, with the Relative Strength Index (RSI) hovering just under the neutral 50 mark and Moving Average Convergence Divergence (MACD) in negative territory, which together hint that downside pressure persists even as volatility has compressed.
On the topside, initial resistance is formed by the 20-day Bollinger middle band near $77.54. A daily close above this barrier would be needed to ease immediate selling pressure, with the upper Bollinger band up at $86.92 acting as a more distant bullish target.
On the downside, the lower Bollinger band around $68.17 offers the next notable support zone should bears regain traction, and a break beneath that floor would expose deeper losses in the broader corrective phase.
(The technical analysis of this story was written with the help of an AI tool.)
Silver FAQs
Silver is a precious metal highly traded among investors. It has been historically used as a store of value and a medium of exchange. Although less popular than Gold, traders may turn to Silver to diversify their investment portfolio, for its intrinsic value or as a potential hedge during high-inflation periods. Investors can buy physical Silver, in coins or in bars, or trade it through vehicles such as Exchange Traded Funds, which track its price on international markets.
Silver prices can move due to a wide range of factors. Geopolitical instability or fears of a deep recession can make Silver price escalate due to its safe-haven status, although to a lesser extent than Gold's. As a yieldless asset, Silver tends to rise with lower interest rates. Its moves also depend on how the US Dollar (USD) behaves as the asset is priced in dollars (XAG/USD). A strong Dollar tends to keep the price of Silver at bay, whereas a weaker Dollar is likely to propel prices up. Other factors such as investment demand, mining supply – Silver is much more abundant than Gold – and recycling rates can also affect prices.
Silver is widely used in industry, particularly in sectors such as electronics or solar energy, as it has one of the highest electric conductivity of all metals – more than Copper and Gold. A surge in demand can increase prices, while a decline tends to lower them. Dynamics in the US, Chinese and Indian economies can also contribute to price swings: for the US and particularly China, their big industrial sectors use Silver in various processes; in India, consumers’ demand for the precious metal for jewellery also plays a key role in setting prices.
Silver prices tend to follow Gold's moves. When Gold prices rise, Silver typically follows suit, as their status as safe-haven assets is similar. The Gold/Silver ratio, which shows the number of ounces of Silver needed to equal the value of one ounce of Gold, may help to determine the relative valuation between both metals. Some investors may consider a high ratio as an indicator that Silver is undervalued, or Gold is overvalued. On the contrary, a low ratio might suggest that Gold is undervalued relative to Silver.
Recommended Articles


Comments (0)
Click the $ button, enter the symbol, and select to link a stock, ETF, or other ticker.