

Keine Daten
Suchen
Aktien Marktkurse
Aktienkurse konzentrieren sich auf die Marktdaten der USA, einschließlich Indizes, Sektoren und verwandten US-Aktieninstrumenten.
52564.600+0.26%
7553.900+0.22%
29719.800+0.04%
Verteilung
Neueste
Geschichte
Sektor
Mehr Anzeigen
Angewandte Ressourcen
+1.90%Mercer International Inc+7.05%
Yunhong Green CTI Ltd+4.10%
Smurfit WestRock PLC+3.66%
Software und IT-Dienstleistungen
+1.53%Global Mofy AI Ltd+120.09%
Snail Inc+12.69%
Inuvo Inc+11.01%
Zyklische Konsumgüter
+1.40%J Star Holding Ord Shs+13.68%
Newton Golf Company Inc+13.16%
LightInTheBox Holding Co Ltd+10.92%
Automobile & Autoteile
+1.18%Envirotech Vehicles Inc+9.83%
Greenland Technologies Holding Corp+4.68%
Stellantis NV+4.03%
Uran
+1.15%Uranium Energy Corp+2.61%
Isoenergy Ord Shs+2.55%
Energy Fuels Inc+2.26%
Kollektivanlagen
+1.14%Daxor Corp+8.80%
Sixth Street Specialty Lending Inc+3.36%
Fidus Investment Corp+2.56%
Aktienliste
Nr.
Name
Kurs
Veränderung
Änderung%
Gesamtpunktzahl
Zeit
Volumen
Umsatz
Marktkapitalisierung
Aktien
Preisspanne
Volumen %
52-Wochen-Hoch
52-Wochen-Tief
Dividende
Dividendenrendite
5T
10T
20T
60T
120T
250T
Seit Jahresbeginn
Beobachtungsliste
Aktienanalyse
Meta steigt vorbörslich um 4 %, Muse Spark 1.1-Release stärkt KI-Narrativ, EU-Vorwürfe wegen süchtig machenden Designs schwelen gleichzeitig weiter
TradingKey – Am 10. Juli (Eastern Time) stieg Meta Platforms (META) im vorbörslichen Handel zeitweise um mehr als 4 %. Zum Redaktionsschluss notierte die Aktie bei etwa 655,45 $. Meta schloss am Vortag mit einem Plus von 4,7 %.
TradingKeyan hour ago

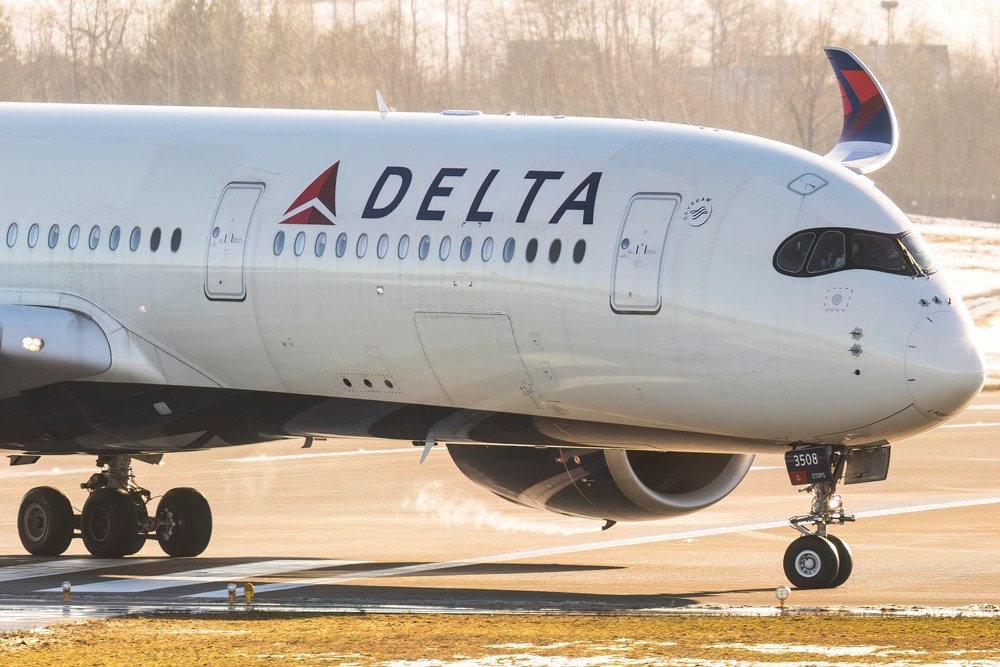
Delta Air Lines Highlights zum Q2-Ergebnis: Raffinerie lässt Treibstoffkosten sinken, Premium-Nachfrage stützt Gewinn über den Erwartungen
TradingKey - Vor dem Hintergrund von Rekordanstiegen bei den weltweiten Ölpreisen und einem stark steigenden Kostendruck in der Branche hat Delta Air Lines, die profitabelste US-Fluggesellschaft, Ergebnisse vorgelegt, die die Markterwartungen übertrafen.
TradingKeyan hour ago
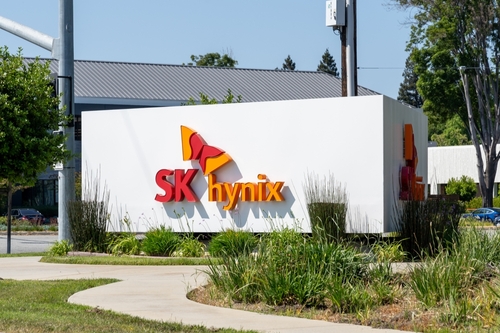
Erster Handelstag der ADRs des Speichergiganten SK Hynix: Worauf sollten US-Aktieninvestoren achten?
TradingKey – Am 10. Juli (US-Ostküstenzeit) wird SK Hynix (SKHY) offiziell an der Nasdaq gelistet, zu einem Preis von 149 $ pro ADR. Mit einem Emissionsvolumen von rund 26,5 Mrd. $ übertrifft das Angebot den Rekord von Alibaba aus dem Jahr 2014 in Höhe von 25 Mrd. $ und wird damit zum größten US-Börsengang eines ausländischen Unternehmens.
TradingKey2 hours ago

Rekordsumme von 26,5 Milliarden eingeworben: SK Hynix debütiert heute an der Nasdaq, wie wird das ADR-Aufgeld die Bewertung von KI-Speichern neu gestalten?
TradingKey – Die American Depositary Receipts (ADRs) des südkoreanischen Speicherchip-Giganten SK Hynix geben heute ihr offizielles Debüt an der Nasdaq und erzielen bei einem Ausgabepreis von 149 US-Dollar pro Aktie einen Erlös von 26,5 Milliarden US-Dollar. Dies stellt einen neuen Rekord für den größten US-Börsengang eines ausländischen Unternehmens dar und übertrifft die 25 Milliarden US-Dollar schwere Kapitalaufnahme von Alibaba aus dem Jahr 2014. Die Notierung, die als „Lackmustest für den KI-Investitionsenthusiasmus der Wall Street“ beschrieben wird, ist nicht nur ein bedeutendes Kapitalmarktereignis, sondern auch eine konzentrierte Bewertung des Wertpotenzials im Bereich der KI-Speicherchips.
TradingKey2 hours ago
US-Vorbörse: SK Hynix ADR mit 149 $ für Nasdaq-Notierung bepreist, Speicherchip-Aktien unter Druck, Delta Air Lines übertrifft Gewinnerwartungen
TradingKey – Am 10. Juli (US-Ostküstenzeit) zeigten die Futures auf die drei wichtigsten US-Aktienindizes im vorbörslichen Handel eine uneinheitliche Entwicklung. Bis Redaktionsschluss fielen die Nasdaq 100 Index-Futures um 0,34 %, die S&P 500 Index-Futures sanken um 0,05 % und die Dow Jones Index-Futures stiegen um 0,12 %.
TradingKey2 hours ago

Japanische und südkoreanische Aktien legen leicht zu: SoftBank springt um 10 % an die Spitze, Samsung und SK Hynix steigen
Die japanischen und südkoreanischen Aktienmärkte setzten ihre moderate Aufwärtsbewegung fort, wobei der Nikkei 225 den KOSPI übertraf. SoftBank legte um mehr als 10 % zu, während SK Hynix und Samsung Electronics den Gewinnen folgten. Kioxia machte seine anfänglichen Kursgewinne rückgängig und notierte niedriger.
TradingKey8 hours ago

TradingKey SmartPicks

TK-Verbesserte Colin McLean Wachstums- und Wertquantstrategie
Die Kombination von Fundamentaldaten mit Marktverhalten durch intelligente Algorithmen nutzt dynamische, mehrfrequente Signale, um die Rendite von Wertanlagen in modernen Märkten zu erhöhen.
Änderung der Bestände


Howard Rothman's Prudent Wealth Strategy
Eine intelligente, quantitative Methode, die sich dynamisch an Bullen- und Bärenmärkte anpasst - eine perfekte Kombination aus stetigem Wachstum und präziser Risikosteuerung.
Änderung der Bestände


David Polen: Rationale Wachstumsstrategie
Diese Strategie setzt Davids Polens Anlagephilosophie fort, Unternehmen mit qualitativ hochwertigem Bargeldzufluss zu halten, und führt gleichzeitig das Bewertungsmodell der impliziten Rendite ein. Ziel ist es, durch quantitative Methoden ein ausgewogenes Wachstum im Verhältnis zum Kaufpreis zu erzielen, während die blinde Jagd nach hohen Kursen vermieden wird und jede Position eine angemessene erwartete Rendite aufweist.
Änderung der Bestände


Michael J. Carr: Strategie für geringes Gewinnwachstum
Diese Strategie basiert auf dem von Michael J. Carr vorgeschlagenen Konzept des „profitablen Investierens“. Ihr Grundprinzip besteht nicht darin, Marktbewegungen vorherzusagen, sondern darin, den aktuellen Risikozustand des Marktes zu bestimmen und darauf aufbauend zu entscheiden, ob und wie Risiken eingegangen werden.
Änderung der Bestände


Bevorstehende Ereignisse
Berichte
Dividende
Aktien-Split
Börsengang
2026-07-10
Vorbörsliches Trading
Delta Air Lines Inc
DAL
EPS-Prognose1.46
EPS Tatsächlich--
Einnahmenprognose17.52B
Tatsächliche Einnahmen--
2026-07-13
Nachbörsliches Trading
Grupo Aeromexico SAB de CV
AERO
EPS-Prognose-0.44
EPS Tatsächlich--
Einnahmenprognose1.50B
Tatsächliche Einnahmen--
2026-07-13
Nachbörsliches Trading
Grupo Aeroportuario del Pacifico SAB de CV
PAC
EPS-Prognose3.49
EPS Tatsächlich--
Einnahmenprognose592.14M
Tatsächliche Einnahmen--
2026-07-13
Nachbörsliches Trading
FB Financial Corp
FBK
EPS-Prognose1.15
EPS Tatsächlich--
Einnahmenprognose177.99M
Tatsächliche Einnahmen--
Markt-Heatmap
Aktien
Sektor