


Nasdaq 100 Index Forecast: Stagnation Signals Appear at Highs, Can AI Still Propel the Index Higher in Second Half of 2026?



AI Podcast


As of July 1, the Nasdaq 100 declined 1.54% to 29,809.13, driven by profit-taking in semiconductor and AI hardware stocks. Despite short-term volatility, institutional sentiment remains optimistic, citing strong earnings growth and sustained AI capital expenditures as bullish catalysts. However, risks include stretched valuations and a lack of market breadth. Technically, the index shows long-term persistence above its 20-month SMA, though monthly bearish patterns near 30,400 suggest heightened correction risks. Key support sits at 26,000; a decisive breakout above 30,400 is required to confirm further upside toward 32,500.

TradingKey - Recently, the Nasdaq 100 Index has experienced a correction at its highs, and the market has begun to reassess the sustainability of the rally in tech stocks. As of the close on July 1, the Nasdaq 100 Index stood at 29,809.13 points, representing a decline of 1.54%. Looking at the market action, the core drag on the Nasdaq remains the semiconductor and AI hardware supply chains. Chip stocks had previously surged too far; once the market began to worry about the return on investment of AI capital expenditures, memory prices peaking, or valuations being overextended, profit-taking quickly amplified rapidly.
Can the Nasdaq 100 Index continue to rise?
However, a short-term pullback does not mean the Nasdaq's medium-term trend has reversed. The core divergence in the current market lies in whether the AI rally is entering the late stage of a bubble, or transitioning from hardware expansion to the earnings realization phase. From the perspective of institutional views, Wall Street remains generally optimistic. Goldman Sachs raised its year-end target for the S&P 500 to 8,000, citing corporate earnings growth as the primary driver of the market's upward trajectory. J.P. Morgan also lifted its S&P 500 target to 7,800, forecasting S&P 500 earnings per share to reach $350 in 2026 and rise further to $390 in 2027. Meanwhile, UBS Global Wealth Management raised its S&P 500 target to 7,900, emphasizing that resilient U.S. consumer spending, AI data center investments, and improving corporate profits will continue to support U.S. equities.
Although these institutions primarily provide targets for the S&P 500 rather than the Nasdaq, they still serve as important references for the Nasdaq. The reason is that AI investment, semiconductor demand, cloud computing capital expenditures, and mega-cap tech earnings are the key pricing factors for the Nasdaq Index. If the S&P 500 still has upside potential under institutional forecasts, the Nasdaq—which is more heavily weighted toward tech and growth stocks—typically exhibits higher elasticity when risk appetite remains stable.
From a market perspective, the bulls' logic primarily rests on three points. First, AI capital expenditures have not yet cooled down significantly, with cloud providers such as Microsoft ( MSFT ), Alphabet ( GOOGL ), Amazon ( AMZN ), Meta ( META) still expanding their data centers, creating sustained demand for chips, storage, servers, optical modules, and power infrastructure. Second, tech leaders retain strong profitability, meaning market gains are no longer solely dependent on valuation expansion but are increasingly driven by earnings growth. Third, if the Federal Reserve refrains from issuing further hawkish signals on rate hikes, easing pressure on long-term interest rates will benefit growth stock valuations.
However, the bears' concerns cannot be ignored. The Nasdaq 100's gains in the first half of the year were highly concentrated, driven almost entirely by a handful of semiconductor and AI hardware stocks, which means the index's apparent strength masks a lack of internal breadth. Once the leading stocks experience consecutive pullbacks, the index's resilience will decline significantly. In addition, the Nasdaq's current valuation is already stretched; if upcoming corporate earnings reports fail to prove that AI investments can generate sufficient profit returns, the Nasdaq 100 Index will face downward pressure.
Nasdaq 100 Index Trend Analysis: Stagflation Signals Emerge at Highs, Short-Term Correction Risks Intensify, Medium-to-Long-Term Bullish Trend Remains Unchanged
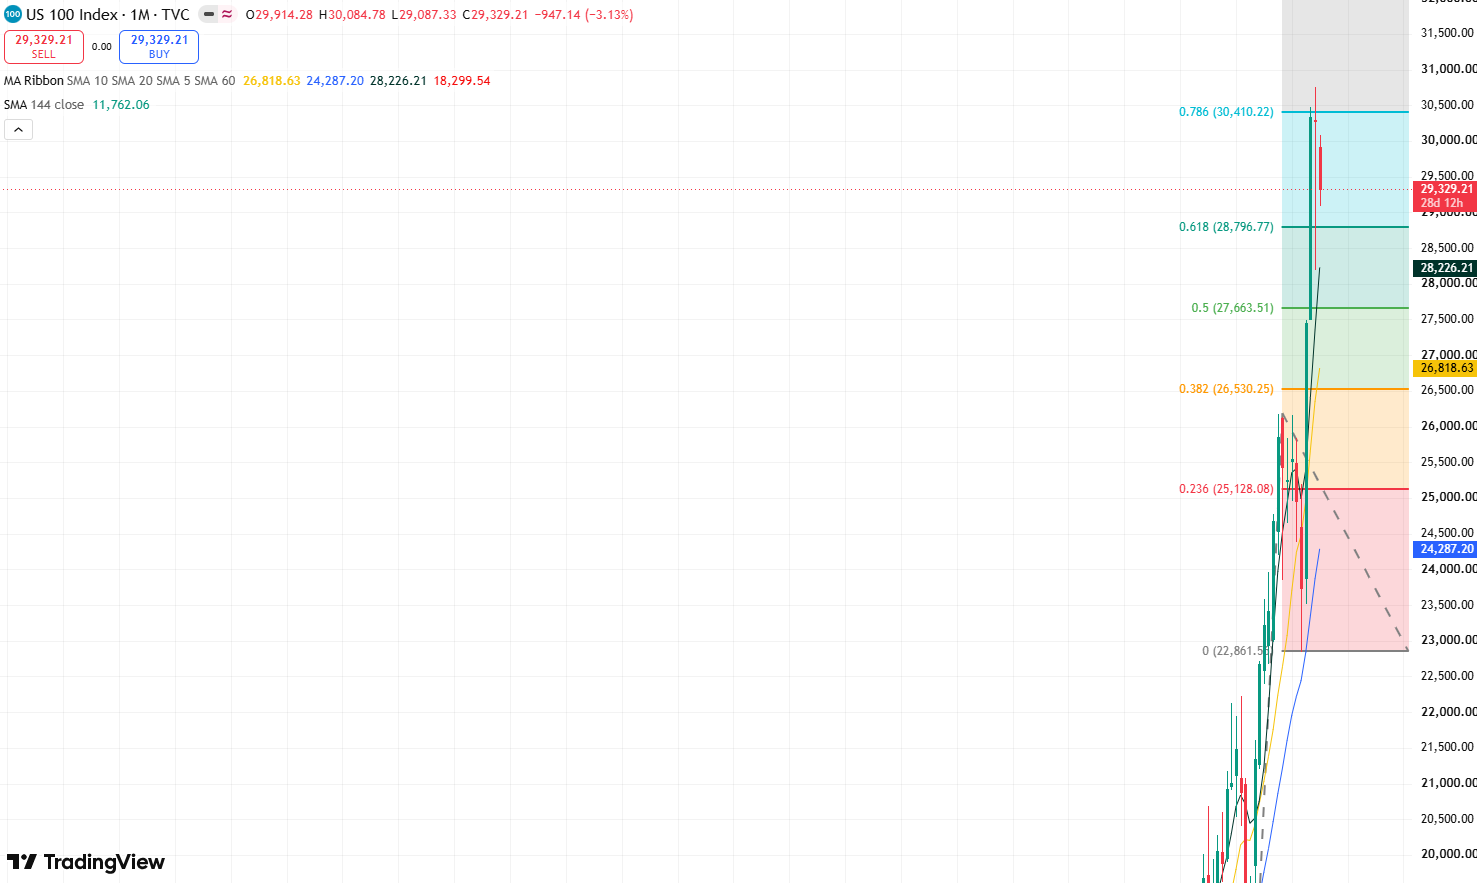
Nasdaq 100 Index monthly chart, Source: TradingView
From the monthly chart of the Nasdaq 100 Index, the candlestick pattern shows a clear trend of higher highs and higher lows. At the same time, the candlesticks have consistently remained above the 20-month Simple Moving Average (SMA20), with several pullbacks failing to break below it, indicating that the overall trend of the Nasdaq remains upward and that this upward trend is highly persistent.
However, it is worth noting that since April of this year, the cumulative gain over two consecutive months reached approximately 27%, which has already exceeded the gain for the entire year of 2025 (which rose by about 20%). This indicates that the market rise is accelerating, leading to a sharp increase in profitable positions and a gradually rising risk of profit-taking by capital. Meanwhile, the Nasdaq closed down 0.19% in June, with the candlestick forming a high-level bearish doji star pattern. This is a very clear signal of stagnation in candlestick patterns, and the likelihood of a high-level pullback continues to rise.
As things stand, the Nasdaq 100 Index has risen to near the 0.786 Fibonacci extension level of 30,400, where the index's movement in June faced resistance and stalled below this position. If the index closes lower in July with a bearish candlestick, the market's bearish momentum will be significantly strengthened, and the index could enter a deep correction phase, with the primary pullback target testing down toward the support level near 26,000. If it breaks below this level, the index could fall further back toward the SMA20 support.
Conversely, if the index can close strongly above 30,400 in July, further upside potential will be unlocked, with the next target testing up toward the 32,500 resistance level, and it could even open up space for a climb toward 38,400.
This content was translated using AI and reviewed for clarity. It is for informational purposes only.
Recommended Articles










Comments (0)
Click the $ button, enter the symbol, and select to link a stock, ETF, or other ticker.