[IN-DEPTH ANALYSIS] FCX: Amid the Rising Tide, Freeport Leads the Way

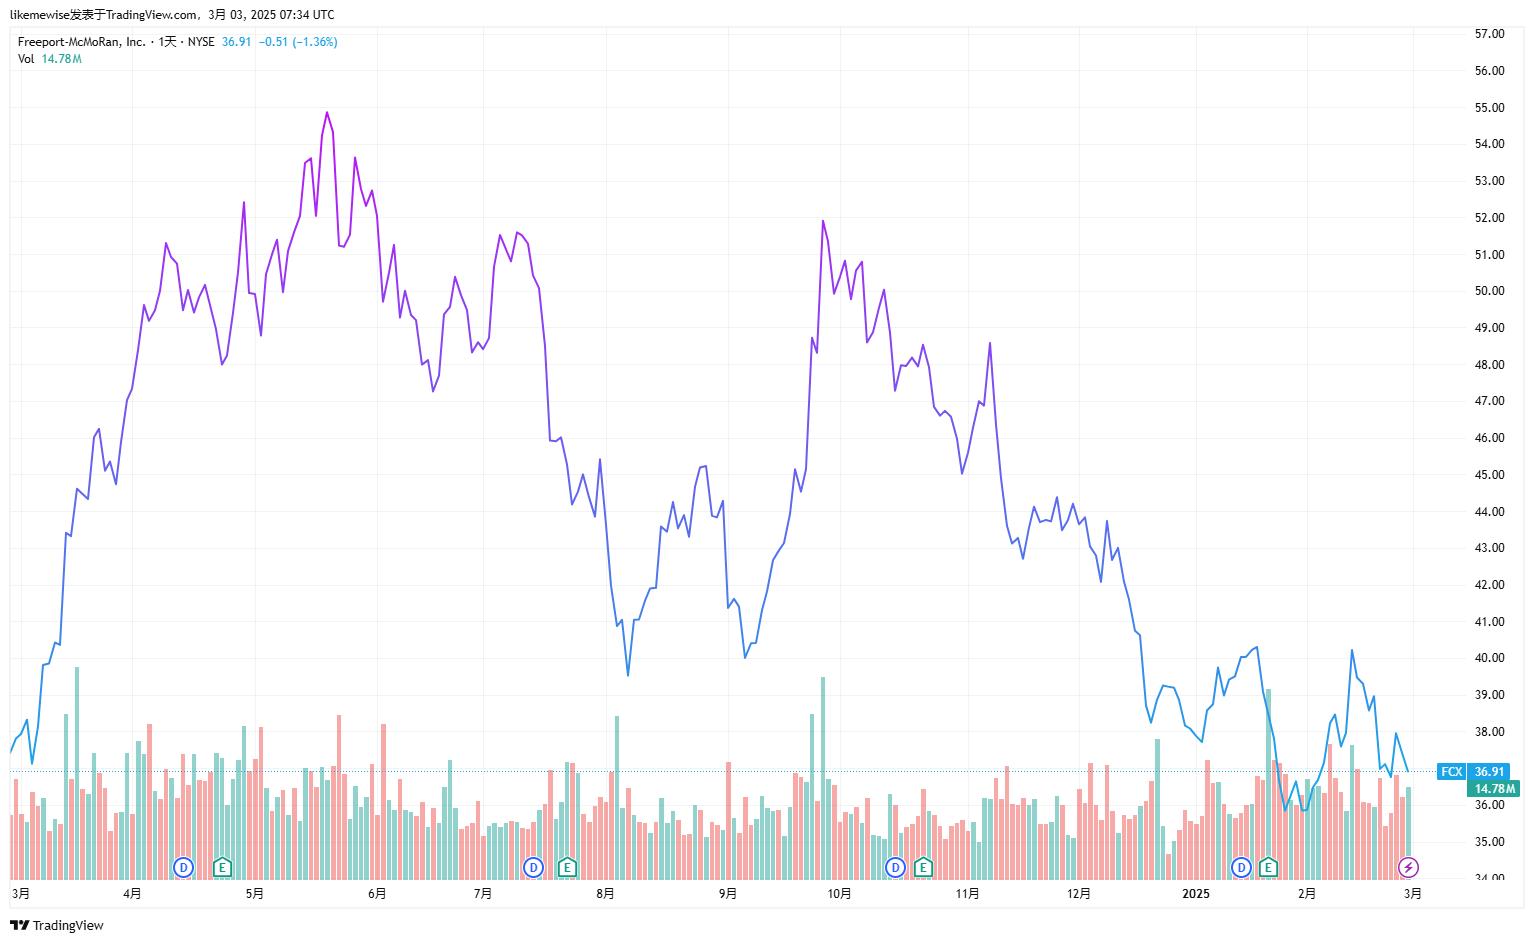
Source: TradingView
Key Points
- Freeport-McMoRan Inc. (FCX) is one of the world's largest publicly listed copper and molybdenum producer. Its business is concentrated in the core mining field, and its revenue mainly comes from copper, gold, molybdenum, etc.
- The global refined copper production is projected to just increase by 1.6% in 2025. FCX has an optimistic production and demand outlook, which will drive the growth of revenue and profit.
- We estimate FCX's fair value trading range to be between $35 and $55/share, approximately over 40% upside potential in an optimistic scenario.
Overview
TradingKey - Freeport-McMoRan Inc. (FCX.N) was established in 1987, headquartered in Phoenix, Arizona, the United States. It is one of the world's largest publicly listed copper and molybdenum producers, and the company's mineral quality is extremely high, especially in the production of copper and gold. In 2024, the company's copper concentrate production was 1.91 million tons, accounting for about 9% of the global total, gold production was 1.84 million ounces, and molybdenum production was 35,000 tons.
The company's copper assets are mainly divided into three major segments: North America (copper mine projects such as Morenci, Safford, Sierrita, Chino, and Bagdad), South America (Cerro Verde copper mine in Peru, El Abra copper mine in Chile), and Indonesia, etc. The total copper mine reserves are 165 million tons. Among them, the Grasberg mine has proven + probable reserves: 13.99 million tons of copper. It is not only one of the world's largest gold mines but also the world's second-largest copper mine.
Revenue Sources
FCX's revenue mainly comes from copper, gold, molybdenum, as well as silver and other products. Among them, the copper business occupies a dominant position in the revenue composition. In the third quarter of 2024, the copper revenue reached 5.02 billion US dollars, with a growth rate of 5.5%. The gold business is also significant. In the third quarter of 2024, the revenue was 1.39 billion US dollars, with a growth rate of over 60%, contributing significantly to the company's business landscape. The molybdenum business also brought considerable revenue to the company, reaching 454 million US dollars in that quarter. The revenue from siver and other products is relatively small.
30-Sep-24 | 30-Jun-24 | 31-Mar-24 | 31-Dec-23 | 30-Sep-23 | |
Copper | 5.02B | 5.11B | 4.88B | 4.53B | 4.76B |
Copper Growth | 5.53% | 13.49% | 20.77% | 4.69% | 11.48% |
Gold | 1.39B | 935.00M | 1.17B | 1.09B | 854.00M |
Gold Growth | 63.23% | -6.41% | 119.96% | 32.84% | -0.47% |
Molybdenum | 454.00M | 476.00M | 421.00M | 444.00M | 479.00M |
Molybdenum Growth | -5.22% | -3.05% | -28.89% | 24.37% | 57.57% |
Silver and Other | 169.00M | 139.00M | 149.00M | 146.00M | 136.00M |
Silver and Other Growth | 24.26% | -18.71% | 12.88% | -9.32% | -21.84% |
Source: TradingKey, SEC Filings
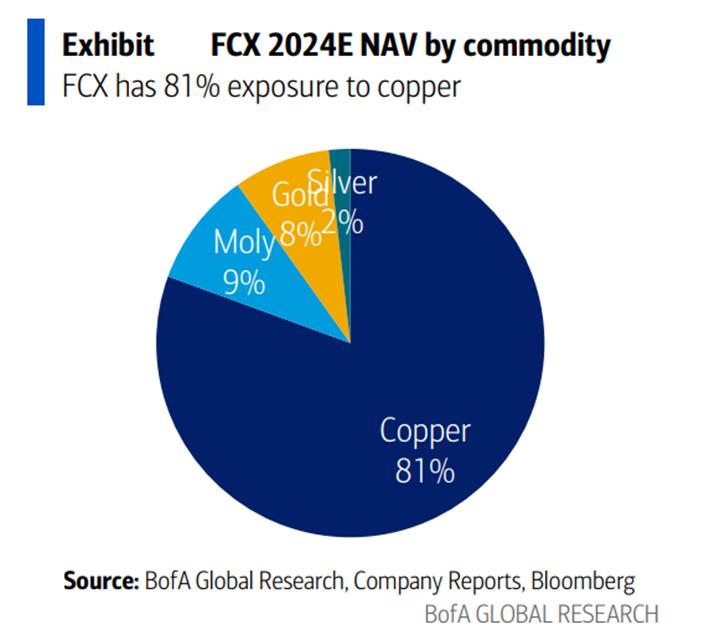
From the perspective of the exposure of net asset value, FCX's asset value is mainly concentrated in copper commodities, with copper accounting for 81%. This indicates that the copper business is FCX's core business and contributes the most to the company's net asset value. In addition to copper, there are other commodities, among which gold accounts for 8%, silver accounts for 2%, and molybdenum accounts for 9%.
Source: BofA Research
2025 Outlook: Main Products
1) Copper
According to the forecast of the International Copper Study Group (ICSG), looking ahead to 2025, the global copper mine production is expected to increase by 3.5% to reach 23.54 million tons, and refined copper production is projected to increase only by 1.6%. Among them, the production growth of Chinese copper mining enterprises is particularly remarkable. Coupled with tariff policies, China's scrap copper imports and circulation are expected to decline by over 10%, contributing to a projected 10% sustained increase in LME copper prices to approximately $10,500 per ton.
Company Name | 2024 Copper Production (10k tons) | 2024 YoY Production Change | 2025 Estimated Copper Production (10k tons) | 2025 YoY Production Change |
BHP | 195.8 | Increase by 10.2% | 194.5 | Decrease by 13k tons |
Freeport-McMoRan | 191.1 | Slight increase of 0.4% | No specific production estimate, | / |
Codelco | 142 | Production increased but fell short of expectations | 139.1 | Decrease by 29k tons |
Zijin Mining | 107 | Increase by 60k tons | 115 | Increase by 80k tons |
CMOC Group | 65 | Surge of 55% | 63 | Decrease by 20k tons |
MMG | 40 | Increase by 14.3% | 49.5 | Increase by 95k tons |
Antofagasta | 67-71 (at the lower end) | H1 YoY decrease of 3.7% | None | / |
Anglo American | 73-79 | / | / | / |
Source: ICSG, TradingKey
2) Precious Metal
Supported by factors such as inflation pressure (the global inflation rate is higher than the historical average, driving the demand for gold as a store of value), the trend of the US dollar (a weakening US dollar may drive up the gold price), and geopolitical risks (the increase in global uncertainty enhances the safe-haven appeal of gold). The gold price is expected to remain high in 2025, but the volatility may intensify. The annual price is expected to fluctuate around $3,100 per ounce, with an upward space of about 10% compared to 2024.
FCX's gold production mainly comes from the Grasberg mine in Indonesia. We expect that the gold production in 2025 is expected to rise to 1.9 million ounces. If the gold price is expected to increase by 10%, the revenue contribution from gold mining will be $4.9 billion.
3) Molybdenum
According to IMARC Group, the global molybdenum market size was 319,700 tons in 2024, and the compound annual growth rate (CAGR) is expected to be 3.7% from 2024 to 2030. The Asia-Pacific region dominates the global molybdenum market, and China is the main driving force (with a CAGR of 4.8%).
For FCX, molybdenum is mainly produced as a by-product of copper mines. With the increase in copper mine production (especially in Chile, Peru, and the United States), both the supply and demand of molybdenum will experience a moderate growth. The revenue contribution from this business segment is approximately $1.9 billion, with a growth rate of 4.6%.
Outlook in 2025: Production Concerns Alleviated
In 2025, the production and demand prospects of Freeport-McMoRan are optimistic. Copper and gold, especially in the fields of clean energy and electric vehicles, will drive the company's revenue and profit growth. With the expansion of the Grasberg mine and the production optimization of mines in the Americas, the copper production is expected to recover steadily. Gold and molybdenum, as high-margin by-products, will further enhance the profitability.
1) Decreasing Uncertainty of the Grasberg
The Grasberg mine is a key asset of FCX, contributing more than 50% of EBITDA. However, in recent years, it has also been a major source of uncertainty for the company. Looking ahead, we believe that the Grasberg mine, as a component of FCX's investment case, has largely reduced the risk. In our view, as part of the license extension, FCX's ownership will further decrease by 10% in 2041, which is well understood by the market and should not be a major negative surprise. Moreover, the further long-term certainty/visibility of investment expansion and potential production growth of the Grasberg mine ensures FCX's long-term leverage to the increase in copper prices.
Indonesia is still a jurisdiction with relatively high risks. However, in our view, with the basic completion of the smelter construction, in 2025, the company is applying to the Indonesian government for a further extension of the export license until the smelter is fully operational again. Considering that the Indonesian government holds more than half of the equity in the Grasberg mine and is highly bound to the interests of the mine, we believe that the company's export license is expected to be extended. The risks of the Grasberg mine have been largely controlled.
Figure: FCX valuation mainly exposure to Indonesia
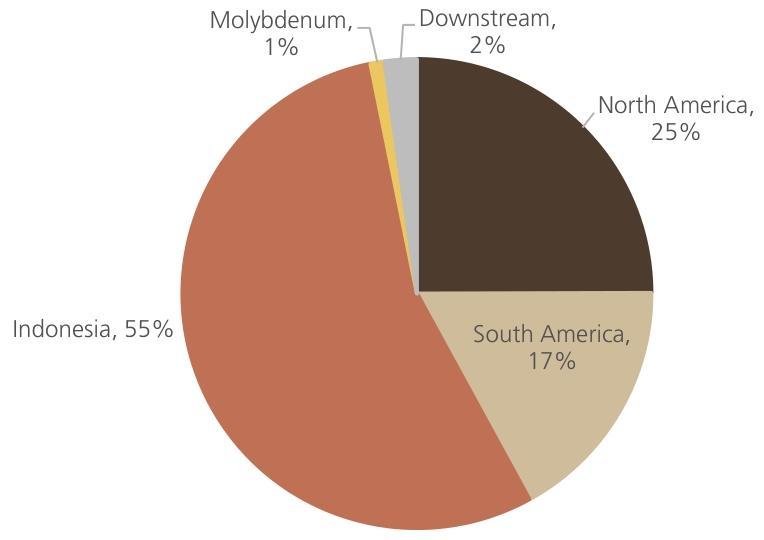
Source: UBSe
2) High Demand-side Elasticity of FCX
The physical market for pure copper will tighten in 2025. Due to the shortage of concentrate/waste copper and the significant reduction of the benchmark for long-term processing charges (TCRC) for copper concentrates in 2025, smelters will face profitability pressure and be forced to reduce production. The supply shortage will continue from 2025 to 2026. However, the demand in the fields of renewable energy, power grids, and electric vehicles will continue to grow. Therefore, we expect that the copper price is still likely to rise. With stable production and slightly lower capital expenditure, it will drive the expansion of FCX's free cash flow in the 2025/2026 fiscal years.
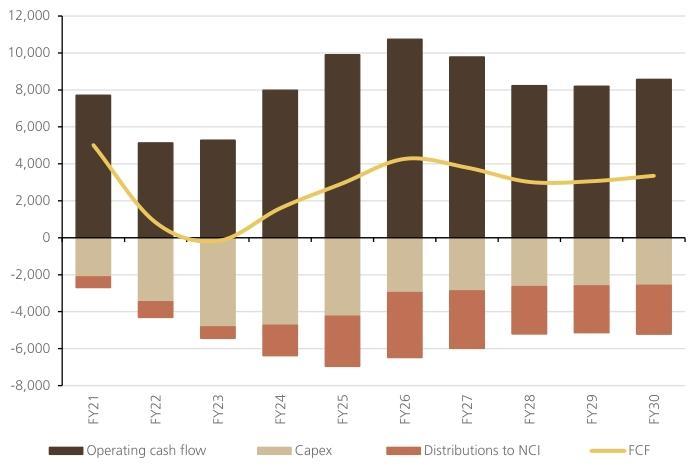
Source:Company data, UBS Research
FCX is the world's largest and most liquid listed producer, and it has a high correlation with the copper price (the beta coefficient is close to 2.6 times). With the completion of the smelter and the expected extension of the Grasberg license, driven by the resilience of the North American economy and sulfide leaching technology, both FCX's production and price are expected to increase.
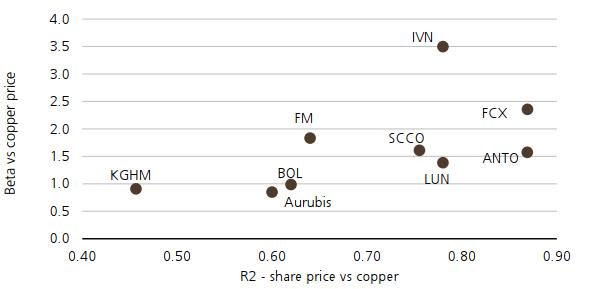
Source: BofA Research
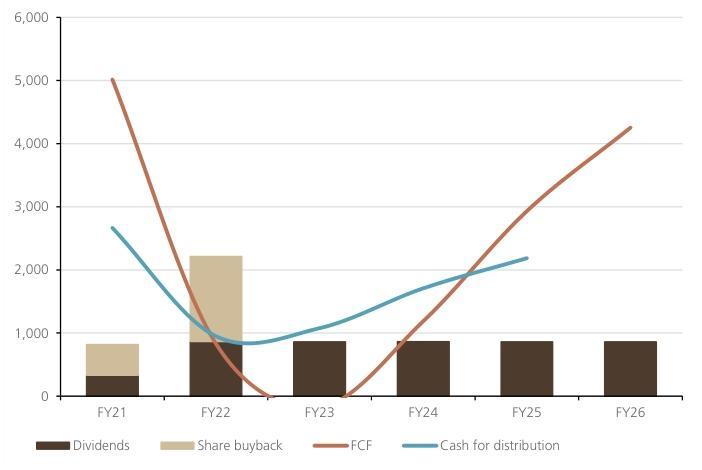
3) Potential Increase in Cash Returns
FCX has a relatively low net debt level, with a consolidated net debt of $3.3 billion (the ratio of net debt to EBITDA is less than 0.5 times). FCX's dividend policy is to distribute 50% of the operating cash flow after deducting capital expenditures. If the adjusted net debt is lower than the target level ($3 billion), the remaining part will be used for deleveraging or returned to shareholders in the form of stock repurchases or dividends. FCX points out that the reason for the decline in the adjusted net debt in recent years is that the discretionary capital expenditure is lower than expected.
FCX's dividend yield is approximately 1.7%, and the spot free cash flow yield in 2025 is 3-4%. If 50% of the excess cash flow defined by FCX, and the free cash flow is higher than the basic dividend, FCX has the potential to increase cash returns (most likely through stock repurchases). And we note that the company purchased a small amount of shares in July 2024 (approximately $60 million, and no stock repurchases were made in 2023).
Source: UBS Research
Financials and Valuation
Judging from the financial report performance in the fourth quarter of 2024, FCX's performance exceeded expectations. The annual revenue reached $25.4 billion, the net profit increased by 28.22% to $4.55 billion, the operating cash flow exceeded $7 billion, the cash cost was controlled at $3440 per ton, maintaining high operational efficiency and profitability.
However, judging from the stock price performance in the past two years, FCX's performance has been inferior to that of its main peers, Southern Copper Corporation (SCC) and Antofagasta plc (ANTO). In our view, part of the reason is that the equity of FCX's core asset, the Grasberg mine, has been diluted from 81% to 48%. Due to the decline in the operating rate of the Grasberg mine, the profit in the first quarter of 2025 reached a new low in two years, and the copper sales guidance for 2025 was adjusted down by 5%, etc.
Nevertheless, FCX still owns the world's highest-quality resources and smelting technology and is expected to significantly benefit from the upward fluctuation of copper prices. Benefiting from the increased demand for energy transformation, the medium-term outlook for copper is convincing. Assuming the price of copper will go up 5-10% in 2025, the FCX production positioning will become clearer. We can see EV/EBITDA is 20% lower the median value of copper producers, we believe that the current price level is an attractive medium-term entry point, with a reference price range of $35 - $55 /share.
Company | Freeport-McMoRan Inc. | Southern Copper Corporation | First Quantum Minerals Ltd. | Ero Copper Corp. | median |
P/E (FWD) | 22.36 | 18.39 | - | 190.15 | 20.36 |
P/E (TTM) | 29.35 | 21.07 | 5,242.36 | 74 | 74 |
PEG (FWD) | 0.86 | 1.77 | NM | 0.2 | 0.865 |
Price/Sales (TTM) | 2.16 | 6.22 | 2.18 | 2.71 | 2.205 |
EV/Sales (FWD) | 2.76 | 6.5 | 3.87 | 3.82 | 3.34 |
EV/Sales (TTM) | 2.82 | 6.61 | 3.77 | 3.86 | 3.525 |
EV/EBITDA (FWD) | 6.85 | 11.51 | 12.11 | 8.54 | 7.695 |
EV/EBITDA (TTM) | 7.53 | 11.8 | 11.13 | 10.72 | 9.125 |
Price to Book (TTM) | 3.12 | 7.86 | 0.93 | 1.79 | 1.665 |
Price/Cash Flow (TTM) | 7.66 | 16.29 | 6.47 | 9.53 | 7.58 |
Source: Refinitiv, TradingKey