

Wells Fargo Q1 2025: Is it a Fragile Fortress or a Mispriced Revival


Inside Wells Fargo’s Capital Strength
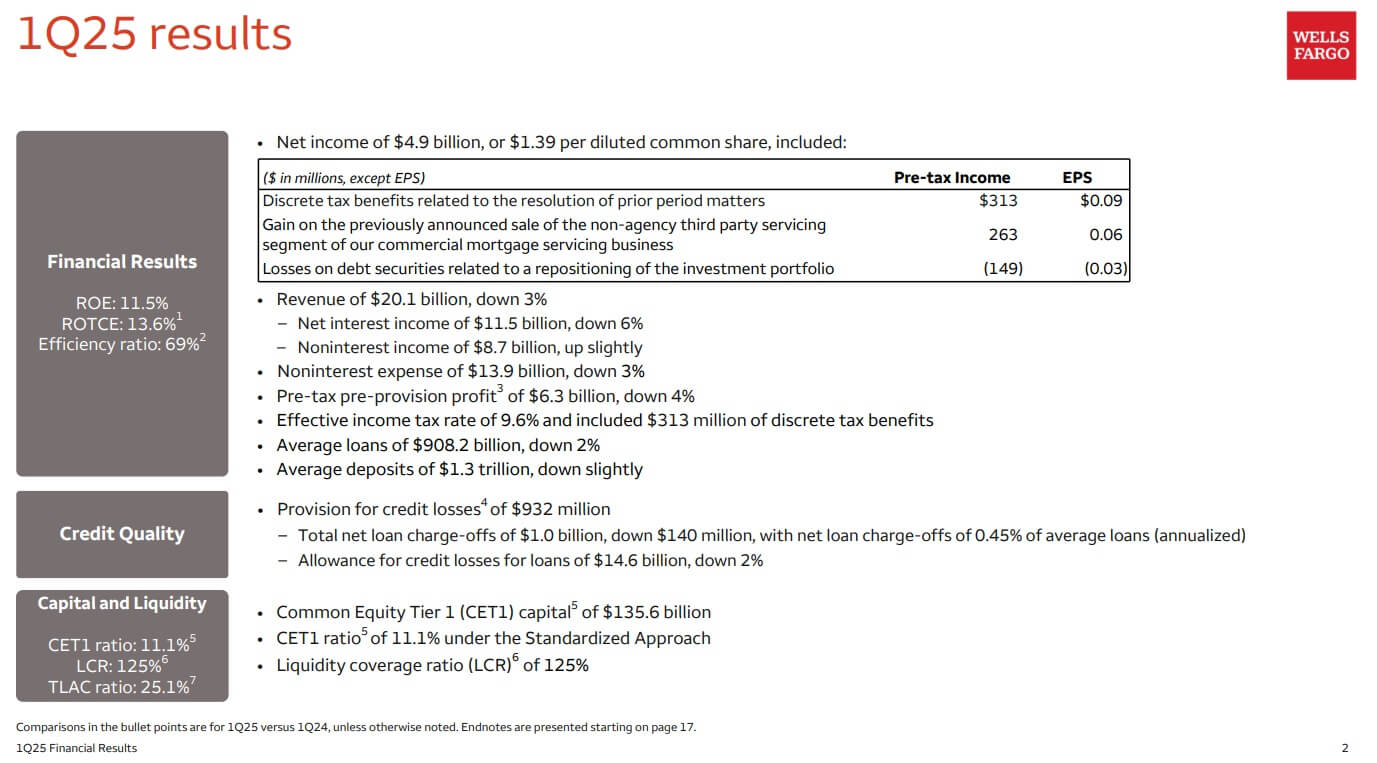
- Net income rose 6% YoY to $4.9B ($1.39 EPS), driven by $3.5B in share repurchases; however, total revenue fell 3% to $20.15B and NII dropped 6%.
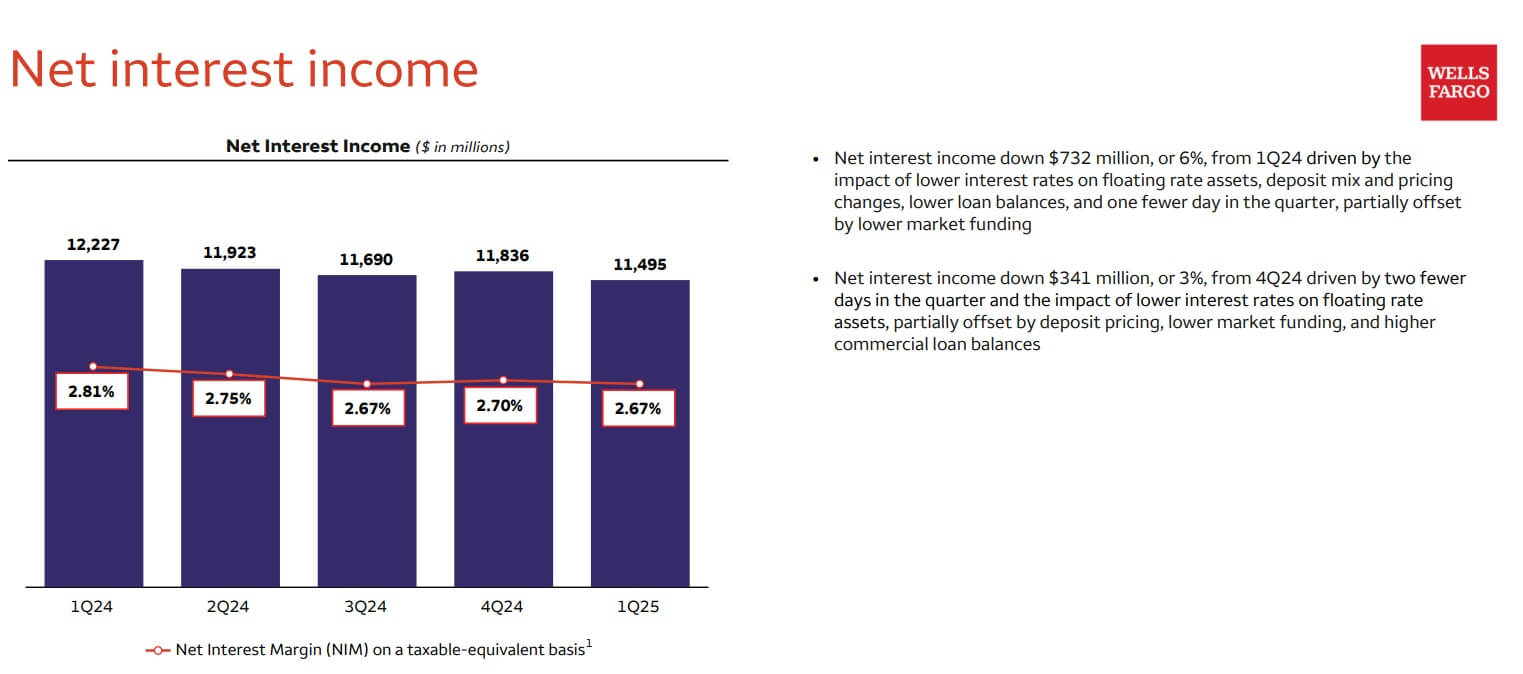
- Net interest margin declined 14 bps YoY to 2.67%, as loan yields fell from 6.38% to 5.96%, while interest-bearing deposit costs only eased slightly from 2.34% to 2.17%.
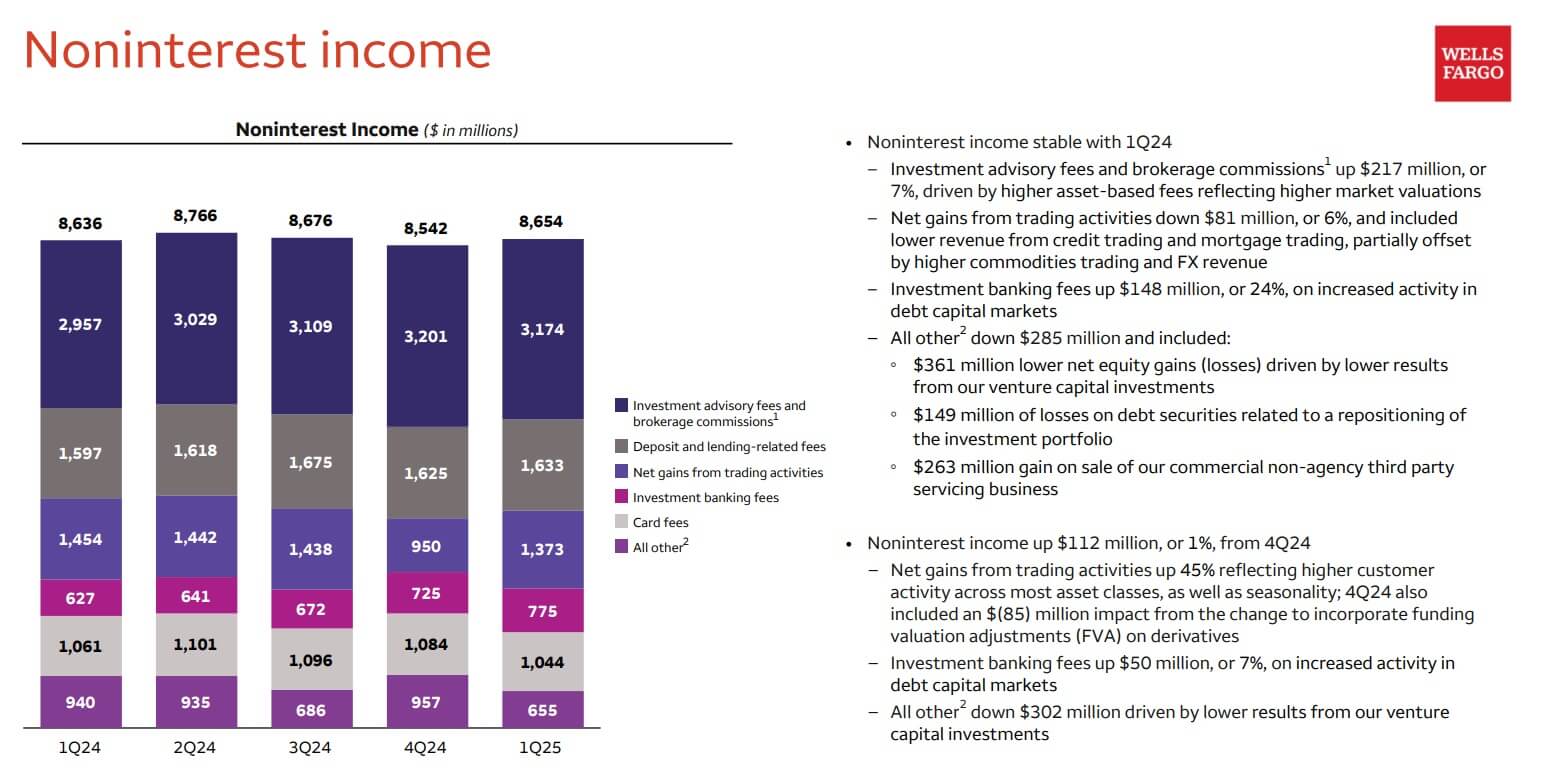
- Noninterest income totaled $8.65B, but excluding a $263M one-off gain from a servicing sale, core fees were flat; equity investment gains fell $361M YoY.
- Net charge-offs improved to $1.01B (0.45% of loans), but $26.4B in office CRE loans remain vulnerable, with 7.9% nonperforming and 11.2% nonaccrual in CIB segment.
TradingKey - Wells Fargo's (WFC) Q1 2025 results present a paradox: resiliency without momentum. Net income on the surface was up 6% year-over-year at $4.9 billion, which is $1.39 a diluted share for a 16% EPS lift driven by forceful share repurchases. But beneath this beat is a flatlining core: revenue was down 3% year-over-year at $20.15 billion, and net interest income (NII), the bank's chief driver, was down 6% due to lower rates, weaker loan yields, and a shrinking loan book.
This deceleration is at odds with Wells Fargo's capital discipline. The bank bought back $3.5 billion worth of stock (44.5 million shares), reducing its diluted share count by 8% year-over-year. The Common Equity Tier 1 (CET1) ratio was unchanged at 11.1%, and the company held a healthy 125% Liquidity Coverage Ratio and 25.1% Total Loss Absorbing Capacity (TLAC) ratio. However, the efficiency ratio, noninterest expense as a portion of total revenue, is stuck at a high 69%, well ahead of peer averages in the low 60s. It implies the bank has yet to realize the operating leverage necessary for revenue to sustainably improve margins.
Return on average tangible common equity (ROTCE) rose to 13.6%, from 12.3% last year, but is short of high-end peers that consistently generate between a 16% to 18% ROTCE. Wells Fargo's focus on capital return is clear, but its failure to convert that restraint into better returns, growth, or both, puts the stock on a valuation purgatory.
Source: Q1 Deck
The Margin Mirage: Spread Erosion and Lending Gaps
The most significant structural issue Wells Fargo continues to face is its decreasing net interest margin (NIM), which dropped 14 basis points year-over-year to 2.67%. This is the fourth consecutive quarter of interest-spread pressure. The reduction came on a dual squeeze: asset yields fell more quickly than funding costs, while interest-bearing deposit costs fell only moderately from 2.34% to 2.17%. Average loan yields fell from 6.38% to 5.96% year-over-year, driven by broader pressure from the rate environment as well as loan mix changes.
Loans do not provide much relief. Average loans dipped by 2% over the course of a year, with commercial balances essentially flat and lending on the consumer side down by 4%. On the consumer side, the auto segment decreased by 21% and personal lending by 10%. On the commercial side, growth on commercial and industrial (C&I) lending was partially met by a reduction on commercial real estate (CRE) exposures. Residential lending was flat, with mortgage originations up a little but loan balances decreasing.
The credit card portfolio was a ray of strength, with balance up 8% year-over-year and purchase volume up by 9%, reflecting consumer stickiness. Meanwhile, credit card charge-offs crept up, mirroring seasonals and tighter family budgets. In commercial banking, net interest income declined by 13% year-over-year even as loan balances rose moderately, gauging the extent of compression of spreads across the bank's lending platform.
With loan growth paused and deposit repricing being stickier than anticipated, the structural threat is evident: unless volume growth is accelerated by Wells Fargo or deposit costs are lowered more substantively, ongoing NIM decline continues to exert pressure on profitability through the second half of calendar year 2025.
Source: Q1 Deck
Fee-Based Strength Ebbs Beyond the Headlines
Noninterest income at Wells Fargo improved slightly to $8.65 billion during Q1, but headline stability conceals a troubling change in composition. A $263 million profit on the sale of its non-agency commercial servicing business helped meaningfully drive the outcome. Excluding the gain, core fee income would have been flat or worse. Equity investment results, driven mainly by venture capital holdings, fell sharply, with net equity gains down $361 million compared to the prior year. Results from trading activities, although seasonally stronger than Q4, fell 6% compared to a year ago.
The company did experience strength in some pockets. Revenue at its Wealth and Investment Management segment grew 4% compared with a year ago, helped by a 6% jump in asset-based charges driven by elevated stock market values. Investment banking fees were up by 13%, driven by greater debt capital market volume, yet remain behind peers with more robust capital markets businesses. Card- and deposit-related charges fell by a small amount, hurt by persisting fee compression and a more conservative consumer.
Overall, Wells Fargo's fee income profile displays its weaknesses. The bank does not possess the commanding trading or advisory relationships of comparators such as JPMorgan or Goldman Sachs. It is underdeveloped compared to fintech innovators emerging in the space of payments. It exposes its noninterest income platform to volatility within certain asset classes as well as one-off events such as the disposal of assets. Lack of a scalable recurring fee engine is a significant shortfall as comparators monetize more broadly through lending, payments, as well as wealth.
Source: Q1 Deck
Asset Quality: Stabilizing Optics, Risks Lingering
At a surface level, Wells Fargo's asset quality trends were reassuringly steady in Q1. Net charge-offs of loans fell to $1.01 billion or 0.45% of average loans, compared to 0.53% for Q4. Net commercial charge-offs were a positive as they fell from 0.30% to 0.16% as losses on commercial real estate (CRE), specifically offices, moderated for the interim.
The improvement, however, might not be sustained. CRE nonaccrual loans were up by a sequential 2% to $3.84 billion, while office loans persistently reflected long-tail distress. The total office exposure at the firm was $26.4 billion, with 7.9% of the loans reported nonperforming. In the Corporate and Investment Banking division, the portfolio of offices had a nonaccrual rate of 11.2%, which has been a cause of concern regarding whether there will need to be write-downs in the future, particularly as refinancing pressures grow stronger across urban markets.
Consumer credit quality was unchanged. Credit card delinquencies were up slightly but within historical context. Auto loan delinquencies improved slightly, while mortgage loan delinquencies were flat. But the portfolio of consumers was under some stress on the margin, as the expenses for provisions were still high, and the provision for credit losses was only modestly decreased to 1.59% of loans.
In brief, while overall credit is presently manageable, Wells Fargo's CRE exposure, particularly its office holdings, is an asymmetric risk, potentially to propel substantial earnings volatility if economic stress recurs or commercial property values fall further.
Valuation: Financial Discipline Without a Rerating Catalyst
Wells Fargo’s valuation multiples indicate a bank that’s fairly valued relative to the sector but substantially discounted compared to its historical norms. WFC is trading at a forward P/E of 12.30, approximately 19% above the sector median of 10.34, but this hides a deeper discount: 33% below its own five-year average forward P/E of 18.40.
PEG ratios also show the subtlety: a forward PEG of 0.86 actually leaves WFC 27% below sector median, implying that compared to projected earnings growth, Wells is offering compelling value. Price/book ratios tell essentially the same story, with WFC both 1.40x trailing and 1.30x forward, approximately 20% above sector medians, yet still trading on historically low multiples for a retail-and-commercial focused bank.
But valuation benefits are partially countered by weak cash flow ratios and yield underperformance. WFC’s price-to-cash flow is an inflated 74.84x, a whopping 707% premium to sector norms, indicating weaker cash conversion or bookkeeping distortions. Dividend yield of 2.23% also lags the sector median of 3.24%, disappointing income-hungry investors, although diminished payout levels might be used as a buffer to sustain future hikes.
Overall, Wells Fargo is favorably valued on traditional earnings and book value multiples, especially given its improving operating consistency post-scandal days. But without more robust cash flow generation and higher capital return signals, the stock’s re-rating potential may remain capped at incremental, and not explosive, gains.
Risk Aversion: Inflation Priced In, Surprises Not
Wells Fargo's downside is cushioned by a conservative balance sheet, solid credit quality, and significant capital buffers. However, a number of risks remain underappreciated:
- Commercial Real Estate Exposure: Office CRE is a major wildcard at present. Provisioning currently seems sufficient, but occupancy downturns or valuation write-downs might cause spikes in charge-offs later on during some quarters.
- Interest Rate Risk: The bank is significantly exposed to rate movements. Continued stress on short-term rates or a flattening of the curve can compress NIM further, reversing growth in earnings.
- Fee Income Volatility: A dependency on one-off gains (equity gains, servicing sales, VC) causes variability in earnings and conceals a lack of scalable recurring streams of revenue.
- Regulatory Drag: Even after Wells has progressed on resolving consent orders, ongoing supervision and operating intricacy can persist to constrain strategic flexibility as well as investor confidence.
- Operating Efficiency Plateau: Wells' 69% efficiency rate implies structural inflexibility. In the absence of major headcount or tech-driven cost reduction, Wells faces potential long-term ROE decline compared with more flexible peers. In a base case, Wells achieves mid-single digit EPS growth rates and high capital returns but is subject to valuation compression if margins contract or credit expenses reaccelerate.
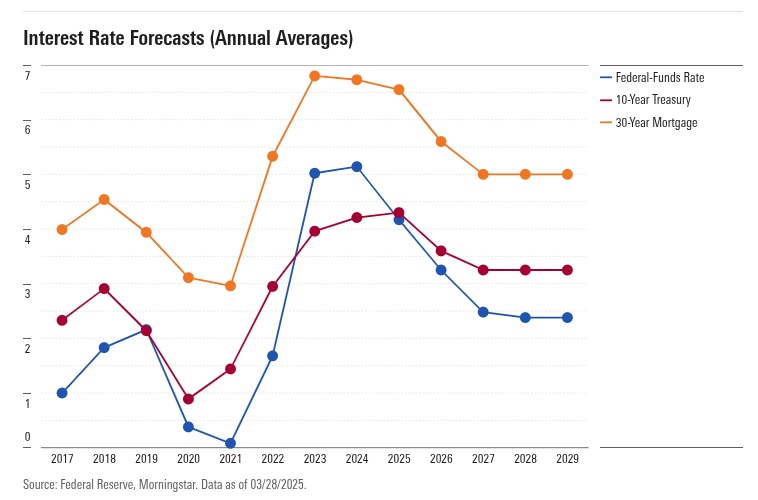
Source: Morningstar
Conclusion
Wells Fargo is a capital fortress amidst an earnings fog. The bank has made significant strides simplifying legacy risks and returning capital to shareholders, but its tepid revenue growth, margin compression, and limited fee scale limit its upside potential. It is currently a defensive holding, not a secular compounder.
Recommended Articles


Comments (0)
Click the $ button, enter the symbol, and select to link a stock, ETF, or other ticker.