

BAC’s Fortress Model Faces a New Test


- Bank of America reported Q1 2025 revenue of $27.4 billion (+6% YoY) and net income of $7.4 billion (+11% YoY).
- Consumer Banking deposits declined 1% YoY to $948 billion, while credit card loss rates rose to 4.05%.
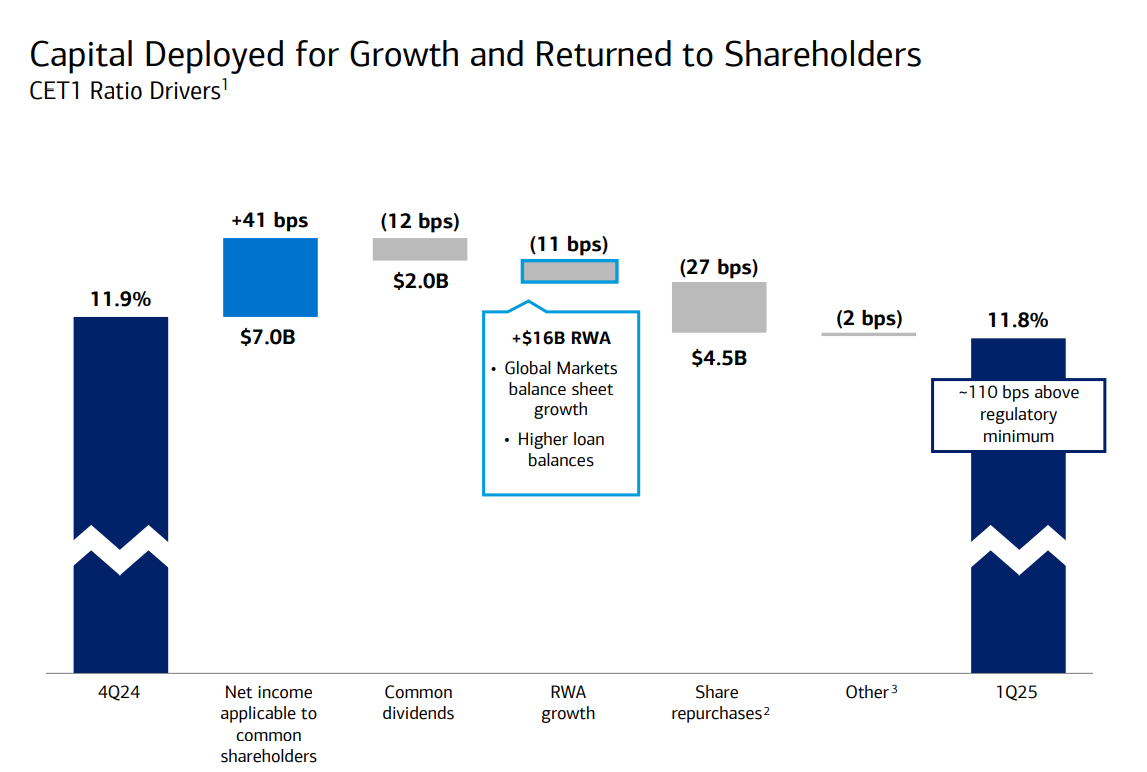
- BAC’s CET1 ratio stood at 11.8%, with $1 trillion in liquidity sources and $6.5 billion in Q1 shareholder returns.
- Forward P/E sits at 10.29, a 15% discount to BAC’s 5-year average, reflecting muted growth expectations despite margin strength.
TradingKey - As markets shift increasingly toward asset-light, AI-leveraged business models, Bank of America (BAC) is distinguished not by its speed, but by its size. With $3.35 trillion of assets and $2 trillion of deposits, it’s tempting to confuse weight with momentum. But under the surface of respectable Q1 2025 numbers is a more complex story: a bank riding disciplined growth, digitalization, and stability of balance sheet through a flattening of the interest rate environment.
The bull thesis? BAC is structurally healthier and more diversified than it’s been in prior cycles. The bear thesis? Operating leverage is thinning, credit risk is re-emerging, and rate tailwinds could morph into headwinds by year-end. The bank’s 6% revenue growth and 11% net income jump to $7.4 billion are compelling, but forward-looking investors need to ask: can BAC maintain its profitability as monetary and macro environments shift?
In this analysis, BAC is assessed on four essential fronts: business model resilience, competitive positioning, strategic and fiscal trajectory, and valuation. This is intended to provide an unvarnished, institutional-calibre analysis on whether BAC is reflective of defensive solidity, or hidden stagnation, within an increasingly disrupted peer group.
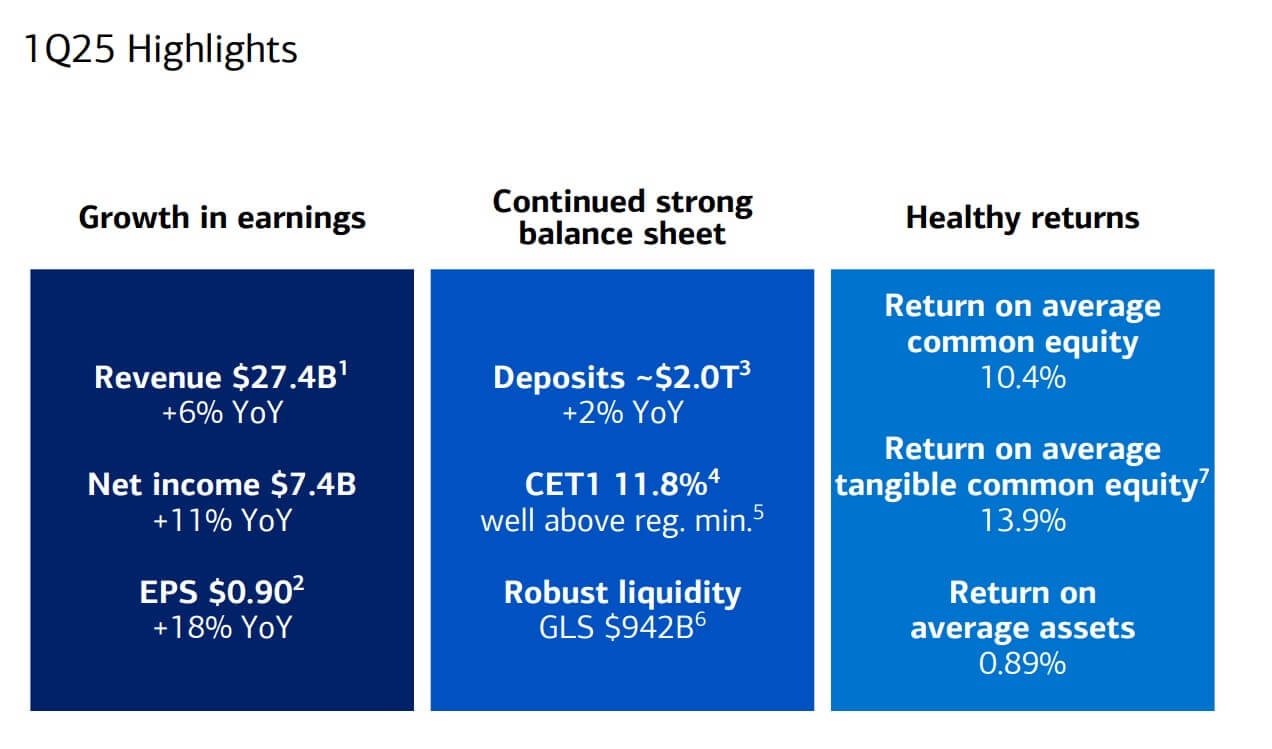
Source: Q1 Deck
Stability with Scale: The Engine Room of Bank of America
Bank of America’s diversified operating model is its foundation. The four main segments, Consumer Banking, Global Wealth and Investment Management (GWIM), Global Banking, and Global Markets, combined for Q1 revenues of $27.4 billion, up 6% from the prior year. While NII gained only 3% to $14.4 billion, fee income had stronger growth, up 10% to $12.9 billion. This balance reflects a strategic shift: less of a dependence on interest-rate arbitrage, more on service, asset, and digital scale.
Consumer Banking, representing 38% of revenues, registered measured growth. A 1% decline YoY by deposits to $948 billion, however, contrasted with a 9% leap by investment assets for virtually $500 billion, driven by $22 billion of net inflows and valuation gains. Balances on credit cards edged up by $100 billion, and spending rose by 4%, citing evidence of continued resilience by the consumer despite 4.05% credit card loss rates, up from 3.79% a quarter earlier. Significantly, the unit’s efficiency ratio of 56% captures both the shift to digital (65% of sales digitally enabled) as well as cost pressure from inflation, as expenses have risen by 6%.
GWIM achieved record performance of 8% total revenue growth to $6 billion and $1.0 billion of net income. Asset management fee income increased 15% as a result of $24 billion of AUM inflows as well as strong equity market gains. The unit’s 22% pretax margin and 87% digital client adoption rate demonstrate a scalable, repeatable revenues engine, highly prized amid a low-rate environment. Loans increased 6% year over year, with the average client still carrying ~$4.2 trillion of balances, with two-thirds of them having a linked banking relationship, deepening wallet share as well as stickiness.
Global Banking registered a flat topline of $6 billion, as deposit growth (+9%) and better treasury service fees (+14%) insulated weakness in lending and investment banking. Revenue from business lending weakened by 13% YoY, as the effects of margin compression and restricted loan demand were evident. Global Markets, however, jumped, generating $6.6 billion of revenue (up 12%), as record Equities trading and a 5% YoY rise in FICC revenue after DVA drove the upswing. This is the twelfth consecutive quarter of YoY sales and trading revenues for BAC, reinforcing its reputation as a rocksteady flow machine during turbulent markets.
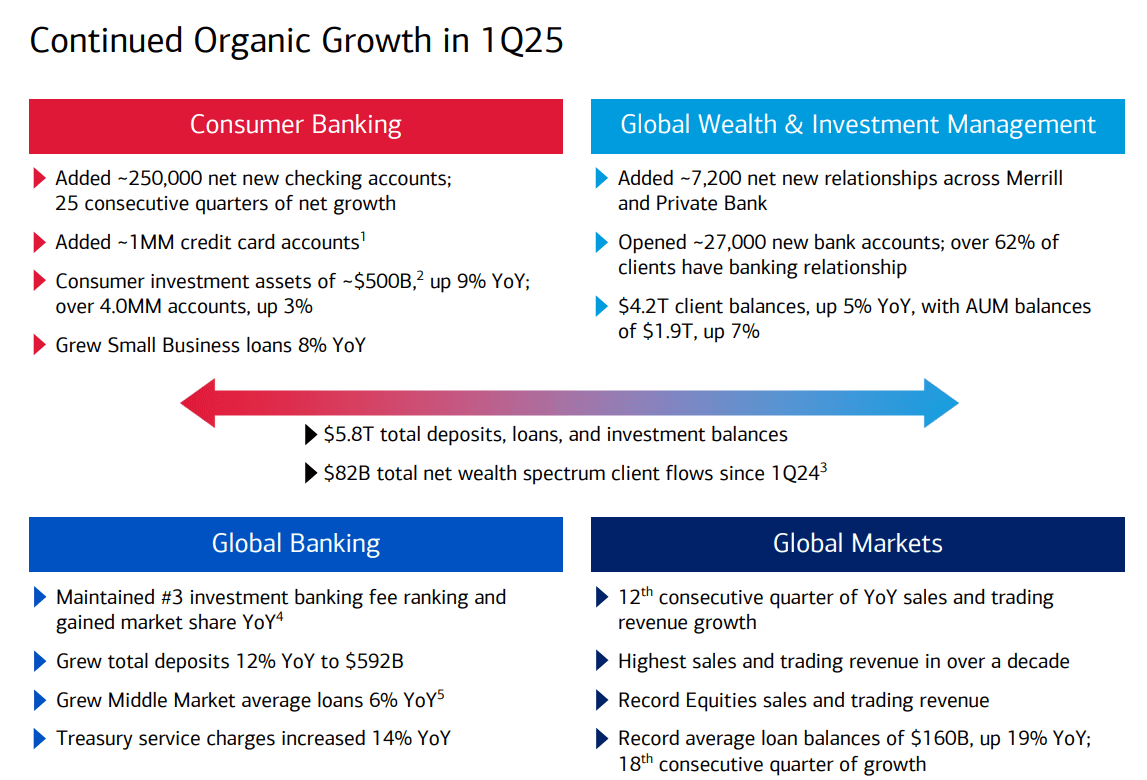
Source: Q1 Deck
Moat or Mirrors? Redefining Competitive Strength for an Age of AI Banking
Bank of America has traditionally leveraged scale as its strength, as artificial intelligence and digital-native competitors reshape banking, adaptability must be paired with its scale. In comparison with its competitors such as JPMorgan, Citigroup, its CET1 ratio of 11.8% is still powerful, with almost a trillion dollars of Global Liquidity Sources. But issues of its ability to sustain margins as well as its pace of innovation exist.
In Consumer Banking, however, No. 1 U.S. consumer deposits still reside with BAC, though its 1.62% net charge-off ratio and increasing cost of deposits of 1.54% (up from 1.43% YoY) convey vulnerability to credit quality and price dynamics. While JPMorgan is further developing its technology stack and investing in generative AI-powered advisory and fraud detection, the digital advantage of BAC feels incremental rather than revolutionary. Its Erica® artificial intelligence assistant had 175.5 million interactions, and Zelle® transaction volume grew 23% to $130 billion, though these gains feel evolutionary, not revolutionary.
In wealth management, Private Bank and Merrill are still racking up awards, but Morgan Stanley’s multi-channel, technology-enhanced model might be attracting more of the next-generation HNW client. While BAC’s $4.2 trillion client deposits are impressive, average deposits fell 4%, and cost savings have flattened out. The unit’s 22% pretax margin is strong, but falls behind Goldman Sachs' 25%+ asset and wealth management margins, where operating leverage is better with AUM.
Global Banking’s decline in investment banking fee revenues (down 3%) reflects a structural headwind. While BAC gained 23 bps of market share to have its #3 ranking, its fee pool continues to lag behind Goldman and JPMorgan. More troubling, business lending margins are eroding, with the efficiency ratio weakening to 53% from 50% YoY. In trading, while Equities revenue achieved a record, BAC lags Morgan Stanley and Goldman Sachs in derivatives innovation and cross-asset infrastructure, both of which are critical for capturing AI-driven volatility trading.
Fundamentally, BAC’s moat continues to protect it from the typical banks, but its reflection in the mirror is being warped by technology-enabled players redefining speed, scale, and personalization of financial services.
Source: Q1 Deck
Strategic And Financial Direction: Growth Without Friction Or Froth
Bank of America's strongest lever is perhaps its ingrained scale and cost discipline. The bank rewarded shareholders with $6.5 billion via $4.5 billion of buybacks as well as $2.0 billion in dividends, while still retaining a CET1 above 110 bps of the minimum set by regulators. But growth is increasingly dependent on non-rate tailwinds.
The quality of revenues is better: noninterest revenues contributed 47% of revenues for Q1 2025 compared with 45% a year earlier. This is driven by strategic bets on investment management, payments, and advisory, not by reducing tail risks from duration mismatch. Pretax, pre-provision income of $9.6 billion rose 12% YoY, with the net income increasing by 11% to $7.4 billion. Return on average tangible common equity (ROTCE) rose to 13.9% from 12.7% as operating leverage is improving, offsetting a 3% increase in expenses.
Loan expansion was balanced: total leases and total loans amounted to $1.11 trillion, up 4% from year-earlier levels, with specific strengths from Global Markets (+19%) and GWIM (+6%). Consumer card balances grew fractionally to $100 billion, while commercial lending advanced modestly by 1%. Notably, the net interest yield excluding Global Markets of 2.47% is higher than the reported 1.99%, reflecting the underlying franchise’s profitability. Asset sensitivity continues, however, to be a concern: a 100 bps decline in rates would decrease NII by $2.2 billion over 12 months.
Cost control was uneven. Total noninterest cost increased by 3% to $17.8 billion, reflecting litigation, compensation, as well as brand spend. The reported efficiency ratio of 65% would actually show minor improvement after adjusting for prior-year FDIC charges. Provisioning for credit remained constant at $1.5 billion, with net charge-offs of $1.5 billion flat year on year. Nonetheless, credit card loss rates increased by 4.05%, and commercial criticized exposure increased by $27.7 billion, indicating hidden credit normalization rather than deterioration.
Strategically, BAC still focuses on “Responsible Growth”, its mantra now extended to include climate finance, digital onboarding (65% of revenues), and further cross-sell among its 59 million digital customers. But the ultimate test will be sustaining earnings power as deposit costs bottom out and loan expansion turns flat.
Source: Morningstar
Valuation: A Margin Premium Without a Growth Bid
Bank of America valuation indicates investors are rewarding its stability of earnings but discounting growth prospects. Its forward price-to-earnings GAAP of 10.29 is practically on par with its peer group median (10.22) but is 15.4% lower than its five-year median of 12.17. The same is true of its trailing price-to-earnings and price-to-sale ratios, indicating 10–14% discounts from historical norms while only taking on slight premiums to peer group medians. These are indications of investor doubt regarding loan growth as well as top-line traction as NII flattens.
In terms of PEG, its forward non-GAAP PEG of 0.84 is attractively valued, 25.9% lower than the group’s 1.13, indicating underlying efficiency assuming further earnings compounding. Yet multiples based on revenues such as the forward P/S of 2.62 are higher than peers (2.47) although still lower than BAC’s historical five-year level of 3.04, indicating that the strength of its margins is not being passed through into accelerating growth.
In general, the bank is trading at fair value compared with peers but at a discount to historical multiples, indicating minimal multiple expansion unless there is a surprise from higher fee growth or operating leverage for BAC. Upside is attributed more so to execution rather than rerating.
Risks:Macro Drift, Regulatory Overhang, and Digital Dilution
The biggest risk for Bank of America is macro-sourced: a decline in rates reduces NII, especially as HTM securities price down. With the bank projecting a $2.2 billion NII reduction from a 100 bps reduction, a discrepancy from Fed-pivot projections could compress profits quickly. Second, credit trends are steady, though delinquencies are increasing in cards and small business, indicating a cyclical turn. A recessionary shock can balloon charge-offs into the 0.75% range on loans, putting pressure on profits. Regulatory risks are ongoing, such as pending capital recalibrations and higher liquidity thresholds.
Furthermore, higher levels of scrutiny of Zelle and digital fraudulent exposure can translate into compliance expenses or reputation loss. Last, BAC’s digital expertise, though strong, risks being outperformed by fintech-native players over the long run. In the event of AI-driven personalization becoming commodity, BAC needs to step up its innovation of the platform lest its revenues decline from younger cohorts.
Conclusion: A Core Compounder With Warning Flags
Bank of America is not broken, nor is it breaking out. It is a capital-effective, technology-adaptive incumbent with solid customer relationships and stable profitability. But the risk-reward depends on the sustainability of its margins and credit control within a slowing macro. On current levels, BAC is providing a stable return and gradual compounding, desirable for risk-averse capital but not as much for seekers of alpha. The thesis: hold it for ballast, not breakouts.
Recommended Articles


Comments (0)
Click the $ button, enter the symbol, and select to link a stock, ETF, or other ticker.