

The $5,600 Gold Crash and the $100 Oil War: Is This the Ultimate Buy the Dip Moment for 2026?


AI Podcast
Gold prices are declining, trading around $4,720, due to rising oil prices fueling inflation fears, a stronger US Dollar, and higher bond yields. This environment, coupled with persistent geopolitical tensions and central banks signaling prolonged high interest rates, is eroding gold's safe-haven appeal. Silver is also significantly down, impacted by leveraged liquidations and concerns over industrial demand. WTI Crude Oil hovers around $93-$94, influenced by supply route disruptions versus SPR release possibilities. Key levels to watch include gold support at $4,630, silver resistance at $74.20, and oil's $92 pivot.
TradingKey - On March 20, 2026, gold prices are falling as rising oil prices have renewed fears about inflation. This has pushed up the US Dollar and bond yields, which is reducing demand for gold, even as tensions continue to rise.
Global Markets are at a bit of a crossroads at the moment - tensions are running high between the US and Israel on one hand and Iran on the other. This has resulted in some serious disruption to energy supply routes and oil prices have gone through the roof. As if that wasn't enough, central banks are still basically saying that high interest rates are going to stick around - which is sending investors scurrying out of safe havens and on the hunt for assets with a bit more kick
There's a real sense that we're experiencing some unusual market conditions. Gold is currently trading at around the $4,720 mark, having dropped significantly from its recent high of $5,600. Meanwhile Oil prices seem pretty steady - supply and geopolitical concerns just won't seem to go away. And that's left investors scratching their heads: is gold still a safe bet during times of high inflation and high interest rates?
Gold Glimmers but Fails to Ignite: The Inflation Paradox
Even with ongoing chaos in the Persian Gulf regarding energy facilities, spot gold (XAU/USD) just can't seem to find its footing. Back in January, it hit a high near $5,600 but since then has taken a tumble and just yesterday managed a 1.5% bounce. Right now, its sitting at around $4,720 - still headed for its biggest weekly loss in years, which can only be described as a wartime slump.
Hence, the recent changes in the bond market can largely be attributed to wartime slump. Moreover, the conflict with Iran has effectively restricted the Strait of Hormuz, pushing up crude oil prices and raising all sorts of concerns about global inflation.
Central banks, not least the Federal Reserve, have responded by making it clear that interest rates are going to stay high for a long time yet. Some of the analysts out there now think that we won't be seeing any rate cuts until 2027 at the earliest. Since gold doesn't pay interest, the higher real yields and a stronger US Dollar have tricked investors out of gold and over to cash.
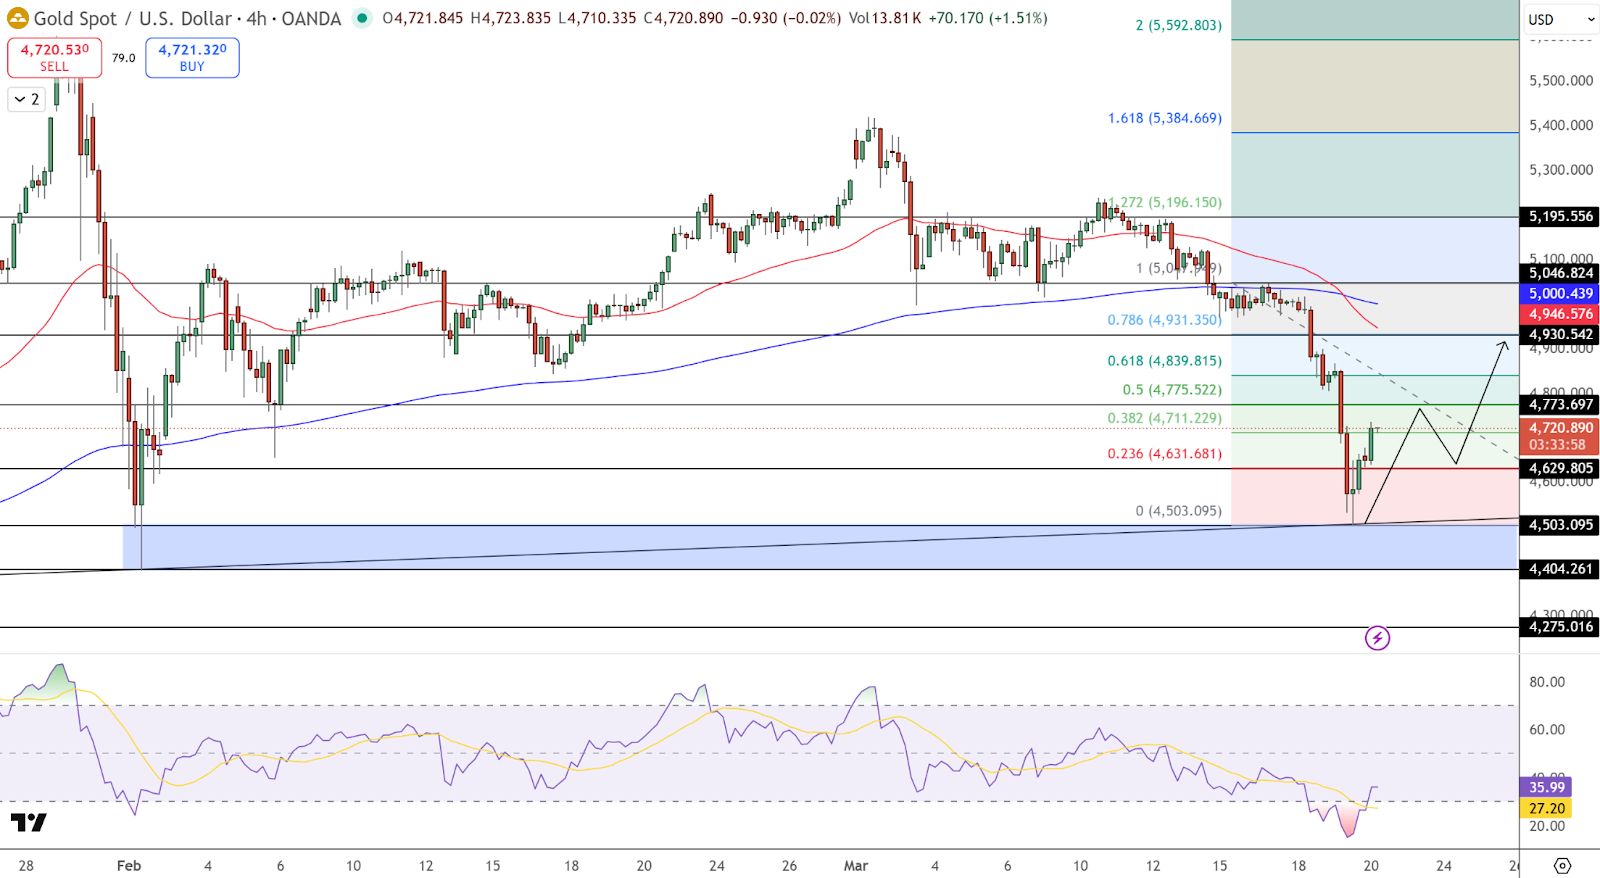
Gold (XAU/USD) Price Chart - Source: Tradingview
Gold Price Outlook: $4,630 Support Holds as Falling Channel Meets Fibonacci Demand
On the 4 hour chart, gold is hovering around the $4,720 mark after taking a pretty sharp tumble from the $5,000 to $5,100 resistance area where it's been stuck for a while. The price is now finding immediate support at around a trading range of $4,630 to $4,650.
A clear downward channel is now forming on the chart, and you can see lower highs following a bit of a downward sloping trendline that tells us the sellers are still in the driving seat. The recent little bounce has given us some smaller candles which is a pretty good sign, though - it looks more like people are being cautious about getting back in rather than a strong reversal taking hold.
The RSI has finally started to come up from its oversold extreme near 27 up to about 36, so that's a bit of a positive sign, but still a good way from actually being out of the woods yet.
If gold does end up falling below $4,630, though, the next stop will be around $4,500. On the upside, if it manages to move above $4,770, gold might make a push towards $4,930. With all that in mind, if you are thinking of getting into long positions then a good entry point might be above $4,770 with a target of around $4,930 and a stop loss below $4,630 would be a reasonable way to go.
Silver Smashed: Leverage and Liquidations Take a Toll
At the moment, Silver(XAGUSD) is trading at a paltry $72.80 which is a far cry from the $85 peak it hit in mid-March. Basically, things got even more hairy this week when the price took a wild swing down to $67, wiping out most of the gains it made in early 2026.
Typically, geopolitical tensions such as the US-Iran conflict are usually good for silver, but on the other hand, market seems worried about potential recession. As skyrocketing energy prices are scaring off industrial buyers. And if that wasn't enough, forced liquidations have added to the pressure.
A lot of retail investors who were using leveraged ETFs got caught with their pants down because they couldn't afford to meet their margin calls when the price tanked. That really set off a chain reaction in the market.
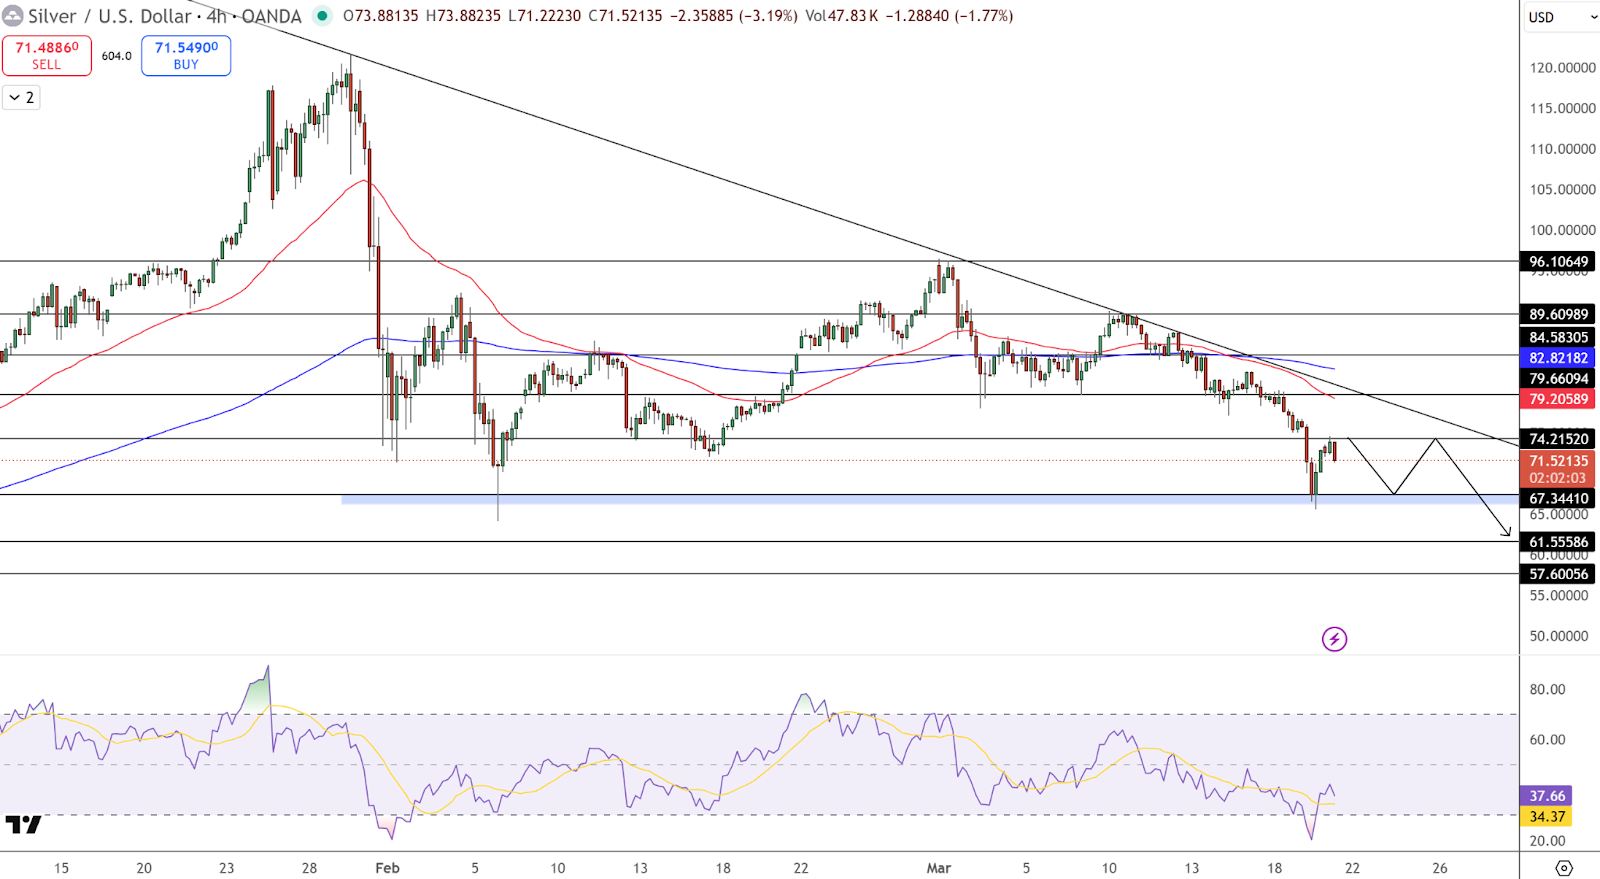
Silver (XAG/USD) Price Chart - Source: Tradingview
Silver Price Outlook: $67 Demand Zone Faces Pressure Under Descending Trendline
Taking a look at the 4 hour chart, silver is sitting at $72.8 after taking a tumble from the $96 resistance area. The writing's on the wall - the trend is still bearish, with lower highs forming below a pretty clear descending trendline. The recent candles have shown some serious selling followed by a tiny bounce at $67.3 - now the buyers are trying to stem the bleeding but so far, they're not managing to turn the trend around yet.
On the support and resistance front, initially trading range of $67 to $68 is like a ticking time bomb as it’s acting as a key support zone. A bearish breakout below this trading range is likely to send silver price towards $61.5.
On the flip side, immediate resistance is at around $74.2, with $79.6 waiting in the wings near the 50 SMA and the old price structure.
A small triangle or some kind of consolidation might develop before the price makes its next move. If you think this is your chance to get out, consider selling below $67 with a target of $61.5 and a stop above $74.2.
Oil’s Volatile High-Wire Act: The $100 Battleground
The main cause of today’s market upheaval is still the energy sector, with WTI Crude (USOIL) pitching back and forth between $93-94 a barrel - a far cry from the eye watering $119 spike that sent markets into a frenzy last month.
The market is being yanked in two vastly different directions: on one hand, you've got the actual impact of the Strait of Hormuz being partly blocked off, and on the other, you've got the psychological effect of talk of possible supply disruptions.
US Treasury Secretary Scott Bessent made some comments recently that the possibility of releasing oil from the Strategic Petroleum Reserves (SPR) & easing sanctions on stranded Iranian crude might have temporarily capped price rises, but to be frank the risk premium is still looking pretty high.
A significant chunk of the worlds oil & LNG passes through the Gulf - nearly 20%. If the conflict gets any worse, such as if you see an attack on the infrastructure of Saudi Arabia or Qatar, you can bet your life Brent crude will shoot up to $150 in no time.
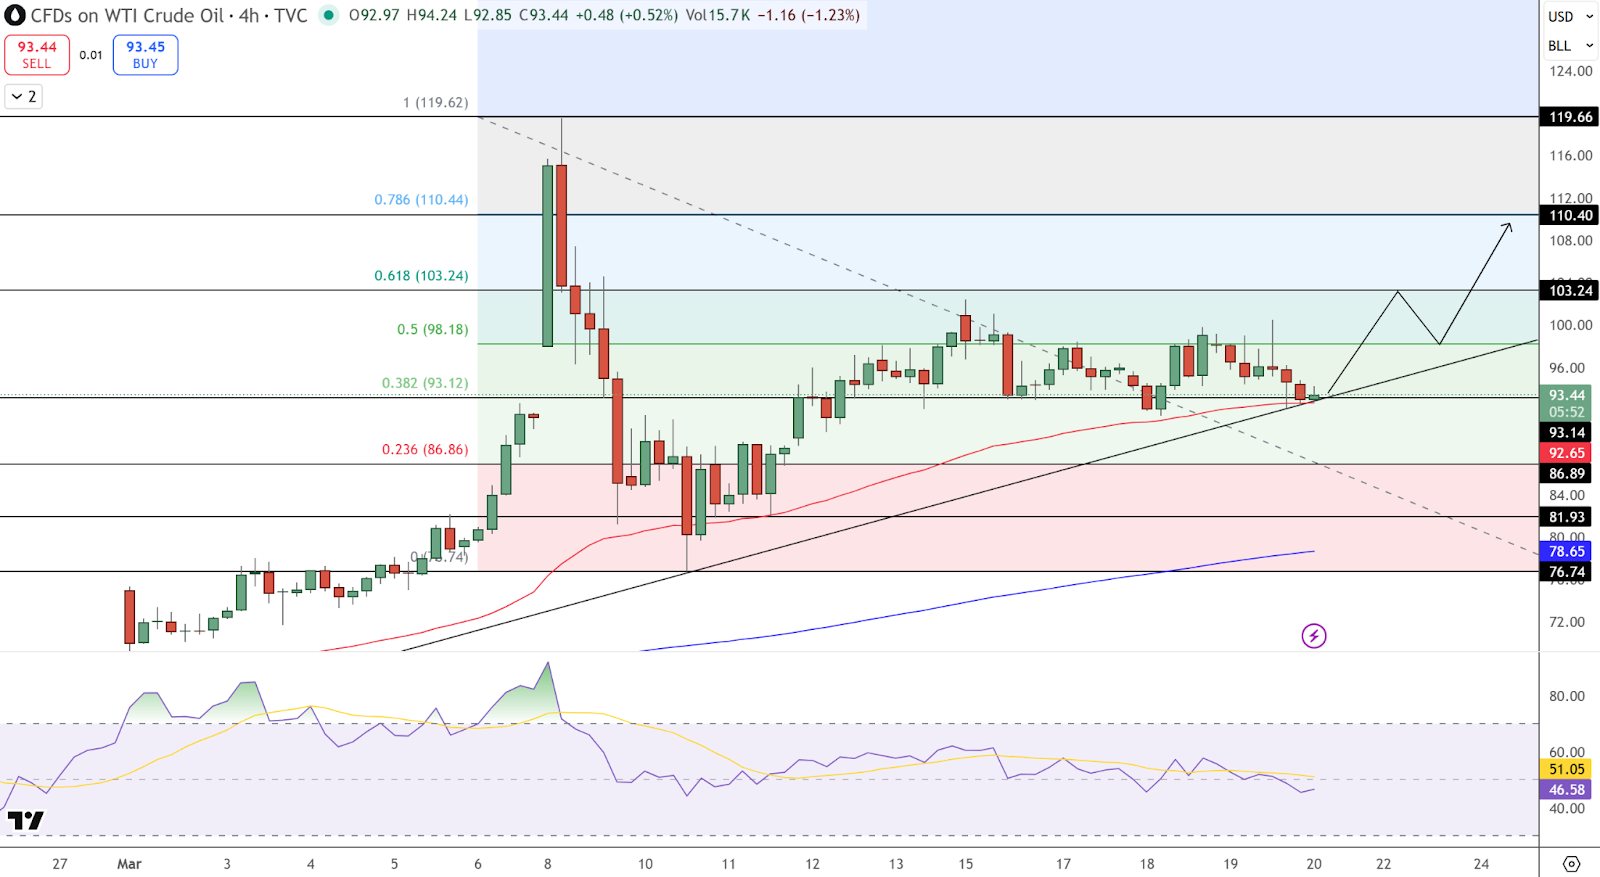
WTI Crude Oil (USOIL) Price Chart - Source: Tradingview
WTI Crude Oil Outlook: $93 Pivot Tightens as Ascending Trendline Meets Fibonacci Resistance
On the 4 hour chart, WTI is hovering around $93.4 & holding above an upward trendline that has been a reliable support since things bounced back from $86.8. The trendline itself still shows a decent level of higher lows - but it's clear the upward momentum is starting to fade as the price continues to struggle its way back up to that $98-$103 Fibonacci resistance zone.
The 50-Day Simple Moving Average is basically flatlining around $92.6 - which is pretty much a textbook picture of what happens when a market settles in for a bit of a consolidation. If this price does fall down below $92, watch out for the buyers to get pushed aside and those sellers to come back in and try their luck - with $86.8 being the 1st line of support we'd expect to see.
If WTI can somehow manage to break above $98.2, though - that would be a real sign of strength & might open the doors for some bigger gains, perhaps all the way out to $103.2 and even $110.4. The RSI is currently stuck in neutral zone around 46 to 50 - so really no clear direction to be seeing here.
The price is starting to form a triangle sort of pattern now - with a rising trendline and a flat horizontal resistance line - so for those who are thinking of playing the long game, a buy above $98.2 might be well worth a look, with a target of $103.2 and a stop-loss just below $92.
Market Outlook: What Investors Need to Keep an Eye On
In the short term, commodity prices aren't just subject to the influence of the war - they're now also being pulled in all sorts of directions by the so-called Inference Economy and the stance that central banks take.
Gold Support: Investors are waiting to see if the $4,630 level holds up as a support. If gold manages to hold above this support and the US Fed decides to ease up on things a bit, the yellow metal could start making a comeback towards $5,000 point.
Silver Resistance: Be on the lookout for the $74.20 level - if silver manages to break above it, it could be a sign that the forced liquidation phase is finally coming to an end.
Oil Pivot: The $92 level is likely to be a make or break moment for WTI crude oil. If prices of USOIL slips below this $92 level, it might go after next support zone of around $86. But if they manage to push above $98, then $100 could well be back in play.
To sum this up, whether you are a seasoned trader or just starting out, it's crucial to focus on what's happening with liquidity. The fact that oil has become the new gold means that the usual rules of safe-haven investing are changing fast. Let’s keep an eye on the on-going geopolitical tenstions and position ourself accordingly.
Recommended Articles


Comments (0)
Click the $ button, enter the symbol, and select to link a stock, ETF, or other ticker.