


SanDisk Corporation Stock (SNDK) Moved Down by 8.00% on Jul 7: What Investors Need To Know



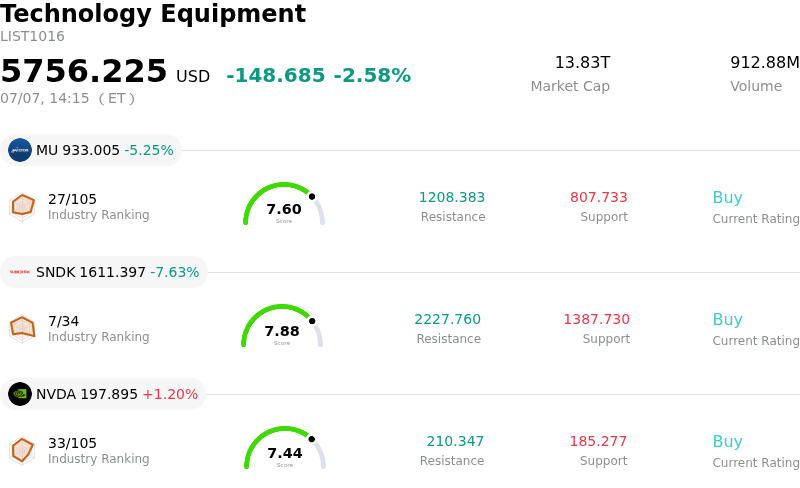
SanDisk Corporation (SNDK) moved down by 8.00%. The Technology Equipment sector is down by 2.58%. The company underperformed the industry. Top 3 stocks by turnover in the sector: Micron Technology Inc (MU) down 5.25%; SanDisk Corporation (SNDK) down 8.00%; NVIDIA Corp (NVDA) up 1.20%.
What is driving SanDisk Corporation (SNDK)’s stock price down today?
SanDisk Corporation experienced significant intraday volatility, continuing a downward trajectory that has put the stock under heavy selling pressure. Despite the absence of negative company-specific news, the downturn was primarily driven by a combination of macroeconomic headwinds, broader semiconductor sector rotation, and structural valuation concerns.
A major catalyst behind the downward movement was a severe global semiconductor selloff that originated in Asian markets and rapidly spread to Wall Street. Deteriorating sentiment in Asian tech hubs, highlighted by sharp single-day drops in South Korea’s KOSPI and Japan’s Nikkei 225, triggered a chain reaction among tech investors. This macro-level risk-off environment forced a widespread revaluation of semiconductor equities, dragging down major players across the entire memory chip complex.
Adding to the pressure, market participants are growing increasingly skeptical about the sustainability of current artificial intelligence valuations and the potential peaking of cyclical memory pricing. Although SanDisk recently announced a manufacturing milestone in partnership with Kioxia, the expansion of NAND capacity has inadvertently stoked fears of a future supply glut. This fear of oversupply, coupled with a broader rotation out of high-flying technology stocks as investors lock in profits following an extraordinary multi-month rally, heavily outweighed positive fundamental indicators.
The stock’s technical setup also worsened as the decline accelerated. Breaking below critical moving averages has heightened the focus of short-term traders on key technical support levels, intensifying the intraday volatility. Even though several Wall Street analysts, including those from Goldman Sachs, have recently upgraded or reiterated high price targets for SanDisk based on strong long-term enterprise demand, these optimistic projections have been temporarily ignored by a market highly focused on short-term cyclical risks and macroeconomic tightening.
Technical Analysis of SanDisk Corporation (SNDK)
Technically, SanDisk Corporation (SNDK) shows a MACD (12,26,9) value of -110.437, indicating a neutral signal. The RSI at 46.793 suggests neutral condition and the Williams %R at 92.224 suggests oversold condition. Please monitor closely.
Media Coverage of SanDisk Corporation (SNDK)
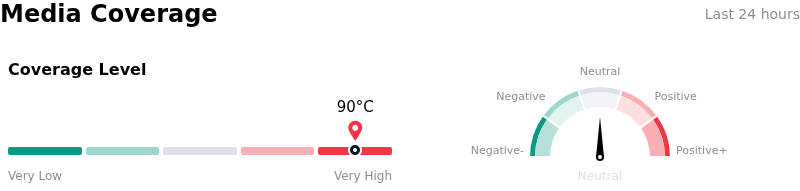
In terms of media coverage, SanDisk Corporation (SNDK) shows a coverage score of 90, indicating a very high level of media attention. The overall market sentiment index is currently in neutral zone.
Fundamental Analysis of SanDisk Corporation (SNDK)
SanDisk Corporation (SNDK) is in the Technology Equipment industry. Its latest annual revenue is $7.36B, ranking 10 in the industry. The net profit is $-1.64B, ranking 41 in the industry. Company Profile
Over the past month, multiple analysts have rated the company as Buy, with an average price target of $1884.63, a high of $3250.00, and a low of $250.00.
More details about SanDisk Corporation (SNDK)
Company Specific Risks:
- Severe Vulnerability to NAND Cyclicality and Spot Market Pricing: Despite securing long-term hyperscaler contracts, approximately 60% of SanDisk's NAND production remains unhedged and exposed to volatile spot-market pricing; any sudden cooling in memory pricing or overproduction immediately threatens its profit margins.
- Extreme Customer Concentration: SanDisk's revenue model exhibits high concentration risk among a small group of big-tech hyperscalers; if these key customers scale back their aggressive capital expenditure on AI infrastructure, the company's forward growth trajectory faces a steep decline.
- Stretched Valuations and Technical Breakdown: Trading at an elevated price-to-earnings ratio exceeding 60x, the stock recently breached its 20-day and 50-day moving averages as part of a sharp 25% correction from its all-time high; this downside volatility is intensified by bearish divergence in its Relative Strength Index (RSI), indicating technical exhaustion and risk of further correction.
- Increasing Persistent Insider Selling: Recent open-market data highlights that corporate insiders have been actively offloading shares, signaling potential skepticism from executive management regarding the sustainability of the company's parabolic valuation run.
This article may include AI-generated content that is human-reviewed, which is for reference and general information purposes only and does not constitute investment advice.
Recommended Articles








Comments (0)
Click the $ button, enter the symbol, and select to link a stock, ETF, or other ticker.