

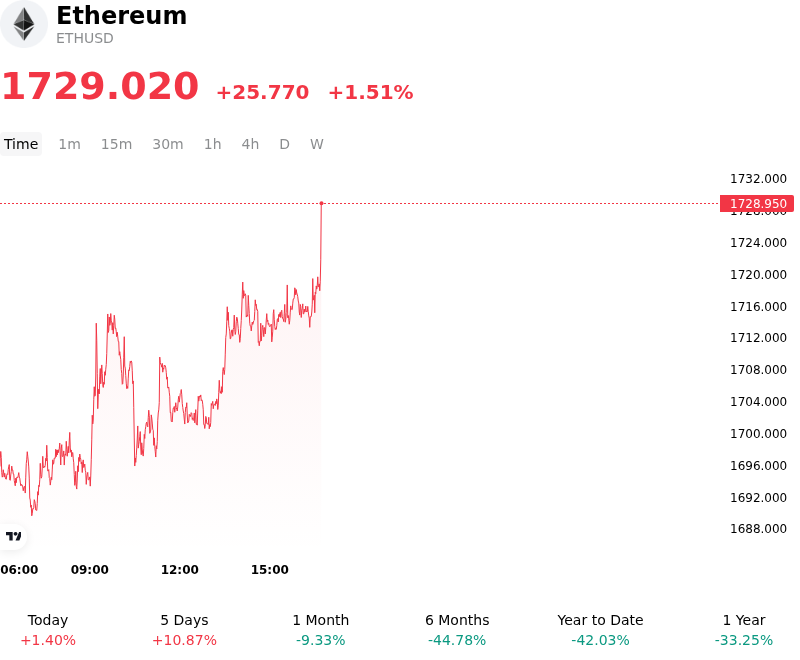
Ethereum (ETHUSD) Is up 1.51% on Jul 3: Key Drivers to Watch

Ethereum (ETHUSD) is up 1.51% at Jul 3 04:45(ET), now at $1729.02, with a 7-day up of 10.24%.
What is driving Ethereum (ETHUSD)’s stock price up today?
The modest advance in Ethereum reflects a cautious stabilization following a severe multi-month correction that culminated in heavy selling throughout the preceding quarter. This positive intraday movement is primarily driven by a shifting macroeconomic backdrop and tentative signs of a trend reversal in institutional product flows. Recent dovish rhetoric from Federal Reserve officials has eased broader market pressures, renewing investor hope that global monetary policy will transition toward a less restrictive stance. This shift in rate expectations has softened the upward momentum of U.S. Treasury yields and the dollar, providing much-needed relief to risk assets and encouraging capital rotation back into major digital assets.
On-chain and fund flow metrics highlight a notable shift in institutional activity that has supported this upward momentum. After experiencing sustained outflows from spot Ethereum exchange-traded funds, net inflows have recently turned positive. This return of spot ETF demand suggests that institutional investors are starting to view the heavily discounted prices as an attractive entry point, rather than continuing to reduce exposure. Additionally, on-chain data shows substantial accumulation by larger wallets, indicating that long-term holders and institutional players are defending crucial structural support levels. This accumulation has effectively absorbed selling pressure and bolstered market depth.
The derivative markets also point to a healthier positioning structure. While recent liquidations of leveraged long positions had previously washed out weak-handed retail players, the current advance has been characterized by more measured leverage and a rise in options open interest. The relatively high long-to-short ratio across major derivative exchanges further illustrates that market sentiment is stabilizing as traders anticipate a potential bottom. This positive sentiment is reinforced by broader regulatory milestones, such as the full enforcement of the European Union's Markets in Crypto-Assets regulation, which has increased institutional confidence by establishing a clearer and more compliant operating framework for digital asset service providers in Europe.
Despite these supportive catalysts, investors remain highly sensitive to incoming macroeconomic indicators, including labor market updates and inflation reports, which will dictate the Federal Reserve's actual policy trajectory. For Ethereum to transition this temporary relief rally into a broader, sustained structural uptrend, the market will require continued positive inflows into spot ETFs, sustained staking participation, and further evidence of ecosystem growth to overcome the technical resistance levels built during the recent downtrend.
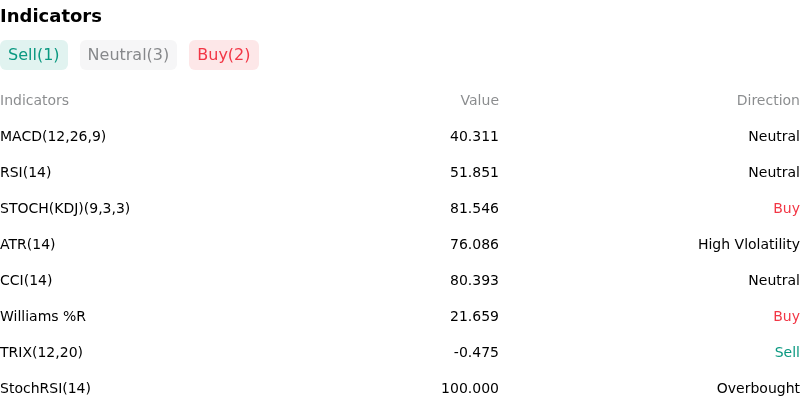
Technical Analysis of Ethereum (ETHUSD)
Technically, Ethereum (ETHUSD) shows a MACD (12,26,9) value of 40.311, indicating a neutral signal. The RSI at 51.851 suggests neutral condition and the Williams %R at 21.659 suggests buy condition. Please monitor closely.
More details about Ethereum (ETHUSD)
Recent Events and Risks:
- Severe Institutional Demand Decay and ETF Outflows: Citigroup slashed its 12-month ETH price target to $2,240, citing highly anemic investor adoption. U.S. spot Ethereum ETFs have suffered from persistent net outflows, draining more than $3 billion during the mid-2026 contraction, leaving the market highly vulnerable to further downside due to the lack of institutional buying support.
- Sustained Whale Selling and Exchange Depositing: On-chain data indicates intensive large-holder distribution, with whales offloading approximately 550,000 ETH ($880 million) in a single week. Weekly exchange inflows spiked past 1.25 million ETH with a doubling in average deposit sizes, signaling deliberate, institutional-grade positioning to sell and amplifying near-term spot supply pressure.
- Deteriorating Network Revenue and Supply Inflation: On-chain metrics reveal a sharp decline in network engagement, with active addresses dropping 46% from their February peak to roughly 420,000. June base-layer network fees plummeted to $10.7 million, down from April’s $24.4 million. This collapse in transaction volume severely curtails the ETH burn rate, introducing inflationary supply pressures that erode Ethereum’s structural value.
- Bearish Technical Breakdown and "Death Cross" Confirmation: From a technical perspective, Ethereum has confirmed a rare weekly "death cross" as its 50-week EMA crossed below the 200-week EMA. This comes after ETH closed Q2 2026 down 25.43%—marking the first three-quarter losing streak in its history. If buyers fail to defend the critical $1,500 psychological floor, a potential liquidation cascade could target major technical support zones down toward $1,150.
This article may include AI-generated content that is human-reviewed, which is for reference and general information purposes only and does not constitute investment advice.
Recommended Articles


Comments (0)
Click the $ button, enter the symbol, and select to link a stock, ETF, or other ticker.