

Applied Materials Inc Stock (AMAT) Moved Down by 5.32% on Jul 1: What Signal Does It Send?

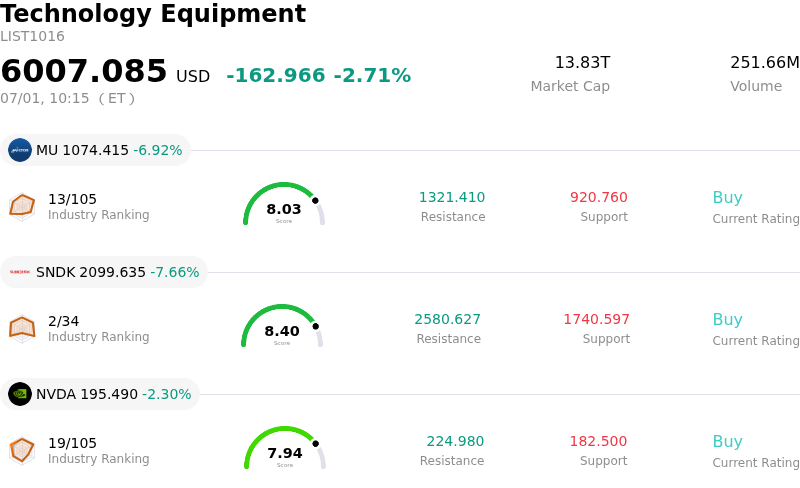
Applied Materials Inc (AMAT) moved down by 5.32%. The Technology Equipment sector is down by 2.71%. The company underperformed the industry. Top 3 stocks by turnover in the sector: Micron Technology Inc (MU) down 6.92%; SanDisk Corporation (SNDK) down 8.01%; NVIDIA Corp (NVDA) down 2.47%.
What is driving Applied Materials Inc (AMAT)’s stock price down today?
Applied Materials is experiencing a downward price movement characterized by heightened intraday volatility. Despite very strong underlying fundamental indicators, the primary catalyst for today’s pullback is profit-taking and a valuation-driven correction following an extraordinary period of market performance.
The company recently concluded its strongest monthly rally in decades, buoyed by the rapid scaling of artificial intelligence infrastructure and surging demand for advanced semiconductor manufacturing equipment. Only yesterday, the stock touched its all-time high, driven by the rollout of a new suite of chipmaking systems targeting the high-bandwidth memory and advanced 3D packaging sectors. This technology addresses the critical memory wall bottleneck in AI servers, which led several prominent Wall Street firms to aggressively lift their price targets.
However, this rapid ascent has pushed the stock’s valuation to historically elevated levels, with its price-to-earnings ratio reaching a decade-high peak. Technical indicators show the stock had entered deeply overbought territory, making a near-term correction highly probable as momentum traders lock in gains.
Adding to the cautious market sentiment are notable institutional and insider portfolio adjustments. Recent filings reveal that high-profile company insiders, including the chief executive officer and various directors, have engaged in significant stock liquidations. While insider selling is often scheduled, the volume of shares sold in recent weeks has reinforced the market’s perception that the stock may be priced for perfection in the short term, fueling the intraday sell-off.
Despite today's downward pressure, the long-term outlook for the semiconductor equipment giant remains robust. The company's recent earnings report comfortable beat expectations on both top and bottom lines, and guidance remains positive. Nonetheless, the current market dynamic reflects a classic consolidation phase, with investors balancing massive long-term AI secular growth against the realities of stretched short-term valuations and technical overextension.
Technical Analysis of Applied Materials Inc (AMAT)
Technically, Applied Materials Inc (AMAT) shows a MACD (12,26,9) value of 22.512, indicating a buy signal. The RSI at 72.354 suggests buy condition and the Williams %R at 6.810 suggests overbought condition. Please monitor closely.
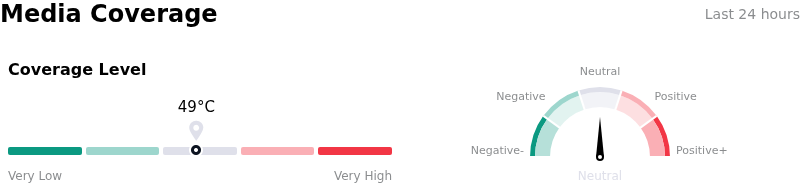
Media Coverage of Applied Materials Inc (AMAT)
In terms of media coverage, Applied Materials Inc (AMAT) shows a coverage score of 49, indicating a moderate level of media attention. The overall market sentiment index is currently in neutral zone.
Fundamental Analysis of Applied Materials Inc (AMAT)
Applied Materials Inc (AMAT) is in the Technology Equipment industry. Its latest annual revenue is $28.37B, ranking 10 in the industry. The net profit is $7.00B, ranking 6 in the industry. Company Profile
Over the past month, multiple analysts have rated the company as Buy, with an average price target of $570.07, a high of $900.00, and a low of $308.00.
More details about Applied Materials Inc (AMAT)
Company Specific Risks:
- Extreme Valuation Multiples and Technical Overextension: Following a massive run up, Applied Materials trades at its highest price-to-earnings (P/E) multiple in over a decade (approximately 57x–64x forward earnings) and a price-to-sales (P/S) ratio of 19x, which is more than double its historical averages. Wall Street bears caution that the current stock price has dramatically run past the consensus target price of $552–$553, raising the risk of steep near-term corrections as technical indicators remain highly overbought.
- Severe Supply Chain and Execution Bottlenecks: To justify current multiples, management must achieve a projected 30% growth rate in its semiconductor equipment business for the calendar year. However, executives have openly flagged supply chain constraints as the primary operational bottleneck, creating severe execution risk in sourcing parts and building complex machines fast enough to meet aggressive AI infrastructure timelines.
- Unsustainable Peak Profitability Margins: The company's recent record-high gross margin of approximately 50%–54% and net margins of 29.3% sit well above historical averages, reflecting short-term pricing power during the AI buildout. These peak margins represent a structural vulnerability to future margin compression from eventual DRAM product cycle normalization, increased material costs, or customer pushback on equipment pricing.
- Substantial Insider Selling: Recent SEC filings reveal aggressive insider liquidations into strength, including CEO Gary Dickerson selling over 103,000 shares in June, alongside multi-million dollar divestments by other high-level executives like SVP Omkaram Nalamasu and Semiconductor Products Group President Prabu Raja. This concentrated insider profit-taking signals potential internal skepticism that the stock can sustain its current parabolic trajectory.
This article may include AI-generated content that is human-reviewed, which is for reference and general information purposes only and does not constitute investment advice.
Recommended Articles


Comments (0)
Click the $ button, enter the symbol, and select to link a stock, ETF, or other ticker.