

Sugar (SUGAR) Is up 2.23% on Jul 1: What Changed in Supply and Demand?

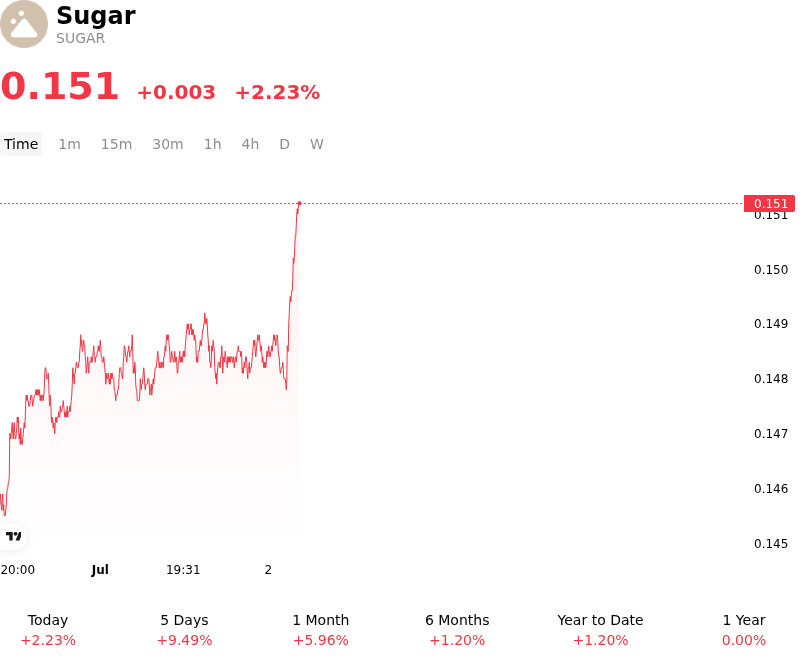
Sugar (SUGAR) is up 2.23% at Jul 1 04:00(ET), now at $0.1512, with a 7-day up of 9.25%.
What is driving Sugar (SUGAR)’s stock price up today?
Sugar prices advanced significantly due to escalating supply-side concerns in major producing nations and shifting dynamics in agricultural weather patterns.
The primary catalyst for the upward price pressure is the worsening meteorological outlook in India, the world’s second-largest sugar producer. Cumulative monsoon rainfall has fallen nearly forty percent below normal historical levels. Forecasts suggesting the region's monsoon season could be one of the weakest in over a decade have stoked fears of severe water shortages, triggering sharp reductions in projected crop yields. Because India has extended its export restrictions to safeguard domestic food supplies, any severe drop in agricultural output threatens to completely remove Indian sugar from the international market. This has forced institutional investors to aggressively reprice global deficit expectations.
Compounding the supply anxieties in Asia are structural shifts in Brazil, the world’s leading sugar producer and exporter. Recent industry data from Unica indicates that sugarcane crushing in Brazil’s key center-south region has fallen year-over-year. Millers are increasingly diverting cane crushing away from sugar and toward ethanol production. Higher global energy and crude oil prices have incentivized this shift by enhancing domestic ethanol margins. Consequently, the percentage of cane allocated for sugar processing has dropped significantly compared to last year, exacerbating fears of a tightening global balance.
The convergence of below-average monsoons in South Asia and the reduced sugar-to-ethanol ratio in South America has prompted major commodity researchers to revise their global sugar balance estimates. Previous expectations of a comfortable surplus have been replaced with a projected global deficit.
While the physical market has faced near-term headwinds from high domestic inventories in regions like China, the international futures market is increasingly reflecting these longer-term structural deficits. Financial participants have reacted by reducing net-short exposure, and commercial buyers are aggressively locking in contracts to hedge against further agricultural disruptions. These factors have jointly driven a sharp repricing in global sugar benchmarks.
Technical Analysis of Sugar (SUGAR)
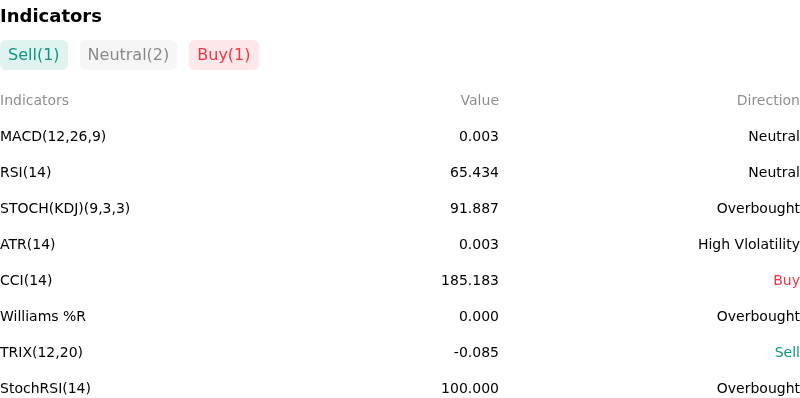
Technically, Sugar (SUGAR) shows a MACD (12,26,9) value of 0.003, indicating a neutral signal. The RSI at 65.434 suggests neutral condition and the Williams %R at 0.000 suggests overbought condition. Please monitor closely.
More details about Sugar (SUGAR)
Recent Events and Risks:
- Geopolitical Risk De-escalation and Lower Logistics Costs: The recent reopening of the critical Strait of Hormuz has dramatically reduced global maritime risk premiums, leading to lower ocean shipping rates and cheaper insurance costs for agricultural trade. This logistical stabilization removes immediate supply-disruption fears and puts downward pressure on global raw sugar futures.
- Crude Oil Declines Reducing Ethanol Incentives: A slide in crude oil prices has weakened the economic incentive for Brazilian and international sugar mills to divert sugarcane crops into ethanol production. If energy prices remain soft, mills are highly likely to maximize their food-grade sugar allocation, exacerbating near-term global sugar oversupply.
- Sluggish Global Demand and Consumption Slowdown: Weakness in physical demand continues to cap price recoveries, with the USDA's recent sweetener reports confirming significant multi-year declines in global sugar deliveries and overall food-consumption use. Physical spot market buyers remain well-stocked and are largely delaying purchases in anticipation of further price declines.
- Comfortable Global Inventories and Rising Stocks-to-Use Ratio: Despite long-term crop concerns, physical inventories remain ample. The USDA's latest global projections highlight a rising global stocks-to-use ratio, climbing to 24.67% on the back of larger localized inventory builds in major importing countries like China and India.
This article may include AI-generated content that is human-reviewed, which is for reference and general information purposes only and does not constitute investment advice.
Recommended Articles


Comments (0)
Click the $ button, enter the symbol, and select to link a stock, ETF, or other ticker.