

Bitcoin (BTCUSD) Fluctuated Significantly on Jul 1: Key Variables Behind the Move

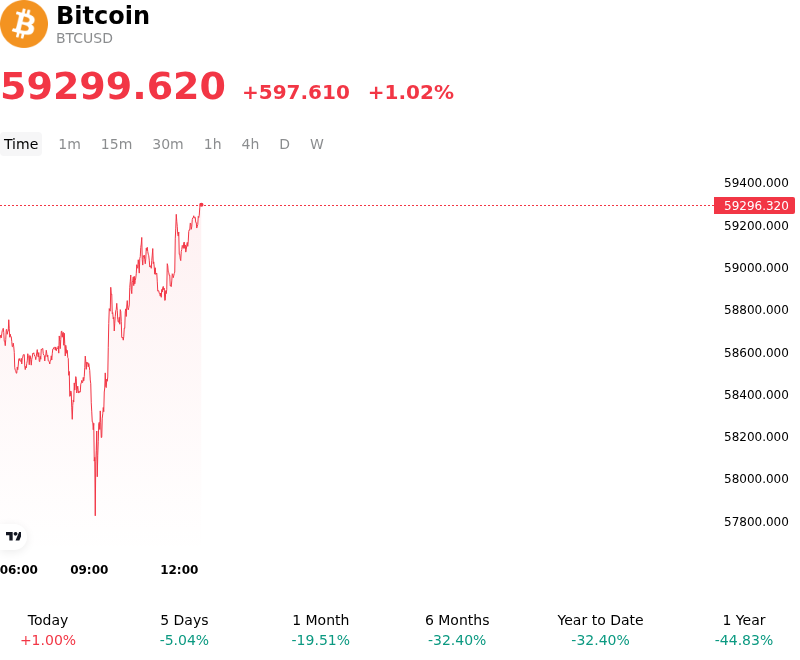
Bitcoin (BTCUSD) is up 1.02% at Jul 1 00:45(ET), now at $59299.62, with a 7-day down of 2.67%.
What is driving Bitcoin (BTCUSD)’s stock price up today?
The moderate recovery in Bitcoin prices during the session reflects a technical rebound after testing a vital psychological and structural support zone. Having briefly fallen below sixty thousand dollars to establish a multi-month low near the fifty-eight thousand dollar level, the digital asset experienced a localized wave of buy-the-dip demand and short covering as sellers became exhausted near the 200-week moving average.
Despite this minor relief rally, structural headwinds continue to restrict more aggressive upside momentum. The primary drag on the market remains the persistent capitulation of institutional capital through spot exchange-traded funds (ETFs). June marked one of the most severe monthly periods of net redemptions on record, driven by deep liquidations in dominant fund vehicles like BlackRock's IBIT and Fidelity's FBTC. This ongoing exit of institutional flows indicates a broader rebalancing of risk-managed portfolios, as elevated Treasury yields and persistent macroeconomic uncertainties in the United States keep investor risk appetite subdued.
Adding to the cautious market sentiment is a notable corporate treasury pivot. Strategy, a pioneer in utilizing Bitcoin as a core treasury reserve asset, announced plans to optimize its balance sheet by authorizing potential asset sales to bolster its cash reserves. This shift from aggressive, programmatic accumulation to strategic capital preservation has introduced a temporary overhang on market supply, challenging the long-term corporate adoption narrative.
On-chain metrics indicate that long-term holders and select foreign institutional players are stepping in to absorb some of this supply at discounted prices. High-net-worth investors and select private banking entities in regions like the Middle East have capitalized on the correction to accumulate digital assets. However, with net capital flows into the broader crypto ecosystem slowing down and stablecoin issuance losing momentum, the structural liquidity needed to sustain a major upward breakout remains constrained.
Looking ahead, derivatives positioning indicates that leverage is gradually flushing out, which could help stabilize near-term volatility. However, the broader trend remains biased toward caution until macroeconomic conditions ease, spot ETF outflows reverse, and the asset can decisively reclaim its short-term moving averages to signal a structural trend reversal.
Technical Analysis of Bitcoin (BTCUSD)
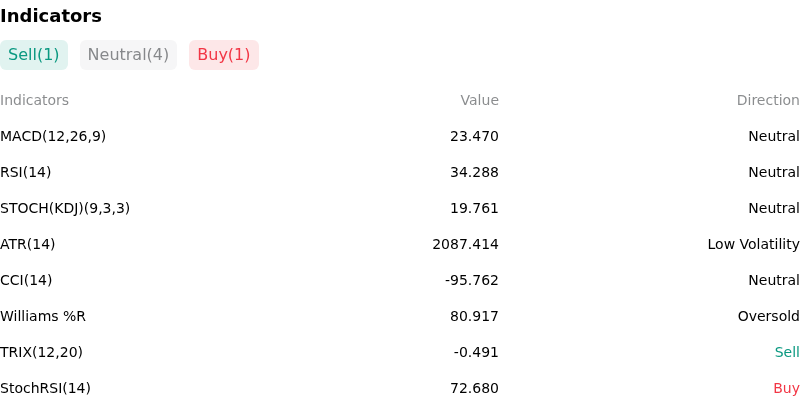
Technically, Bitcoin (BTCUSD) shows a MACD (12,26,9) value of 23.470, indicating a neutral signal. The RSI at 34.288 suggests neutral condition and the Williams %R at 80.917 suggests oversold condition. Please monitor closely.
More details about Bitcoin (BTCUSD)
Recent Events and Risks:
- Unprecedented Institutional ETF Outflows: Spot Bitcoin ETFs recorded their worst month on record in June 2026, bleeding approximately $4.06 billion in net outflows. Continuous daily redemptions, highlighted by a single-day peak outflow of $696.3 million, represent a significant withdrawal of institutional liquidity and sustained selling pressure on BTC spot markets.
- Critical Technical Breakdowns and Support-to-Resistance Flips: Following a decisive weekly close below the pivotal $60,000 support level, Bitcoin is facing immediate downside risk as this crucial threshold flips into a fresh overhead resistance zone. Furthermore, BTC has dipped below its 200-week moving average for the first time in 2026, which historically signals a major structural shift in market momentum and threatens a potential cascade toward the $54,000–$55,000 range.
- Heightened On-Chain Capitulation and Exchange Whale Deposits: Recent blockchain data shows a local spike in the Bitcoin Exchange Whale Ratio to 0.69, indicating that large-scale holders are actively moving coins onto exchanges, which is a key leading indicator for impending sell pressure. This is compounded by evidence of capitulation from cycle-top buyers who acquired BTC near its peaks and are now cutting losses as the price hovers near year-to-date lows.
- Regulatory and Macroeconomic Headwinds: Market sentiment is heavily pressured by a hawkish posture from the Federal Reserve under Kevin Warsh, which has erased expectations for 2026 rate cuts and strengthened the U.S. dollar to multi-decade highs. On the regulatory front, political uncertainty surrounding the potential failure or delay of the bipartisan CLARITY Act crypto market structure bill is deterring fresh institutional entry and prolonging the market's risk-off environment.
This article may include AI-generated content that is human-reviewed, which is for reference and general information purposes only and does not constitute investment advice.
Recommended Articles


Comments (0)
Click the $ button, enter the symbol, and select to link a stock, ETF, or other ticker.