

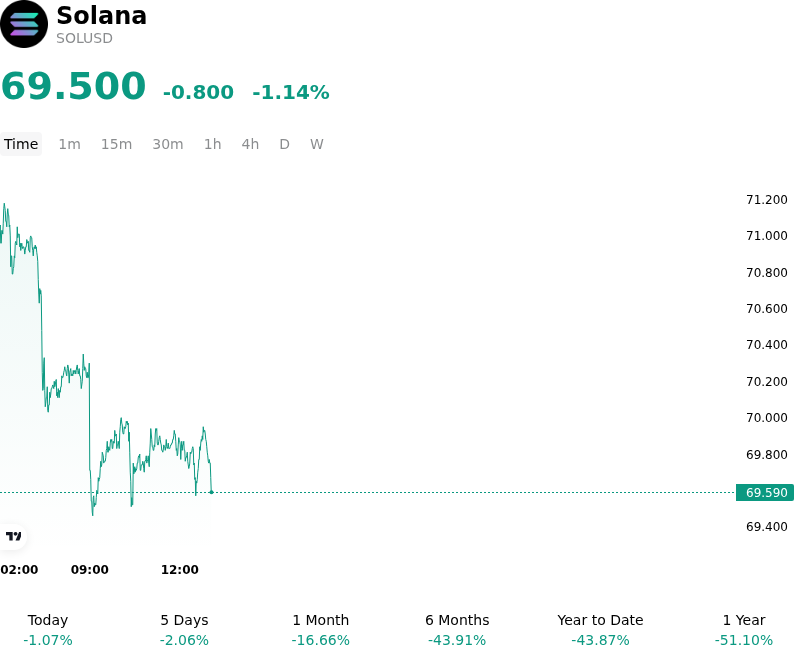
Solana (SOLUSD) Is down 1.14% on Jun 28: Why It Happened

Solana (SOLUSD) is down 1.14% at Jun 28 01:05(ET), now at $69.5, with a 7-day down of 4.03%.
What is driving Solana (SOLUSD)’s stock price down today?
The modest decline and heightened intraday volatility in the Solana (SOLUSD) trading session reflect a confluence of macroeconomic tightening, broader digital asset deleveraging, and specific near-term supply overhangs, which overshadowed recent structural and institutional milestones.
A primary driver of the defensive positioning across the digital asset space is the severe contraction in global macro liquidity. Investor expectations regarding monetary policy shifted hawkishly following surveys indicating that the Federal Reserve could hold interest rates steady far longer than previously anticipated, potentially delaying any rate cuts significantly. This higher-for-longer rate environment, paired with a resilient U.S. dollar and a persistent capital drain into equity-market artificial intelligence plays, has squeezed risk-asset liquidity, forcing multi-asset managers to pare down their crypto exposures.
This macro headwind catalyzed systemic deleveraging across the broader cryptocurrency market. As Bitcoin repeatedly tested critical support ranges near sixty thousand dollars, the resulting market-wide selloff triggered substantial liquidations of leveraged long positions. Due to its high beta and liquid nature, Solana experienced cascading long liquidations, amplifying its intraday volatility.
On-chain dynamics and impending supply events also created localized selling pressure for Solana. On-chain tracking data highlighted a substantial influx of roughly six hundred thousand SOL tokens deposited by large holders into centralized exchanges over the preceding days, signaling hedging and distribution behaviors. Furthermore, market participants are increasingly pricing in potential supply pressure from upcoming token unlocks scheduled for July, alongside the persistent risk of ongoing asset liquidations from the FTX bankruptcy estate. This anticipated supply concentration has emerged at a time when organic on-chain activity, including decentralized exchange volumes and fee generation, has temporarily cooled from its earlier peaks.
Technically, the price action reflects a breakdown of key support structures. The asset completed a bearish double-top pattern after failing to decisively clear overhead resistance, subsequently breaking below key technical levels. This breakdown activated clusters of sell-stop orders, intensifying the downward momentum during the session.
These near-term headwinds have temporarily obscured highly positive structural developments for the Solana ecosystem. While the launch of spot Solana exchange-traded funds in late May has already attracted over one billion dollars in cumulative inflows, and recent high-profile filings by major Wall Street wealth managers signal a clear path toward deeper institutional adoption, near-term flow dynamics remain defensive. Investors are currently prioritizing liquidity preservation and risk management over long-term positioning, waiting for macro liquidity conditions to stabilize and for the immediate supply overhangs to clear before rebuilding high-conviction exposure.
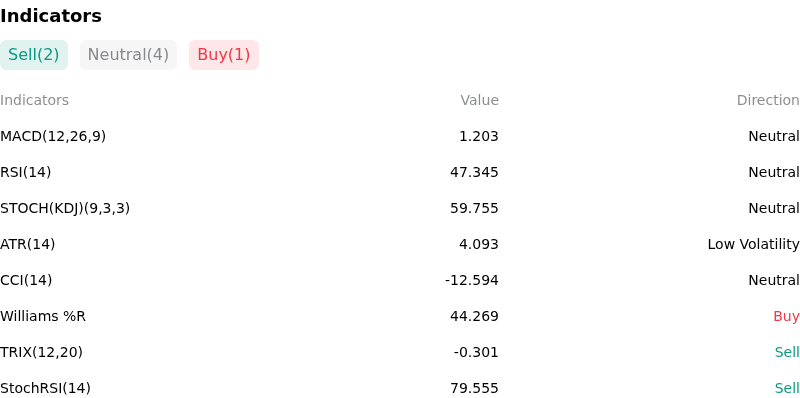
Technical Analysis of Solana (SOLUSD)
Technically, Solana (SOLUSD) shows a MACD (12,26,9) value of 1.203, indicating a neutral signal. The RSI at 47.345 suggests neutral condition and the Williams %R at 44.269 suggests buy condition. Please monitor closely.
More details about Solana (SOLUSD)
Recent Events and Risks:
- Technical Breakdown and Liquidation Imbalances: Following a failure to clear the key $75 resistance zone, SOLUSD completed a bearish double-top pattern and broke below its critical neckline support at $68. This technical breakdown has activated dense clusters of long liquidation stop orders, exposing the asset to a near-term downside target of $60.80.
- Surge in Whale-Led Exchange Inflows: On-chain tracking data from the last 72 hours reveals a sudden deposit of approximately 600,000 SOL tokens into centralized exchanges. This heavy concentration of whale inflows indicates immediate intent by major holders to distribute or hedge, creating severe overhead selling pressure and capping immediate relief attempts.
- Deteriorating Core DeFi and DEX Metrics: Despite recent price volatility, Solana's underlying network demand remains weak, with weekly decentralized exchange (DEX) volumes falling to $10 billion (down from $30 billion in February) and Total Value Locked (TVL) dropping 11% over the past month. Activity across major protocols like Kamino and Raydium has also suffered double-digit declines of 19% and 17% respectively.
- Unstable Protocol Revenue and Memecoin Concentration: Roughly 30% of Solana’s decentralized application revenue remains heavily concentrated in the memecoin generator Pump.fun. This extreme reliance introduces structural volatility risk, as on-chain data shows 55% of participating retail addresses lose capital and 80% of launched tokens fail within 48 hours, threatening the sustainability of the network's transaction-fee model.
This article may include AI-generated content that is human-reviewed, which is for reference and general information purposes only and does not constitute investment advice.
Recommended Articles


Comments (0)
Click the $ button, enter the symbol, and select to link a stock, ETF, or other ticker.