

Micron (MU) Weekend Outlook: After a Record Quarter, Is Another Breakout Coming?


AI Podcast
Micron Technology reported fiscal Q3 2026 revenue of $41.46 billion, a 346% year-over-year surge, with EPS of $25.11 and 84.6% gross margins. Performance was driven by sold-out HBM capacity and multi-year strategic agreements. Despite a post-earnings consolidation to $1,213, technical indicators like a 57.38 RSI and ascending trendline support suggest bullish momentum. The outlook depends on May’s Core PCE inflation data, which could influence tech valuations. With Q4 revenue guidance at $50 billion, Micron aims to stabilize its historically cyclical model, targeting $1,244 and $1,321 levels if current support holds.

TradingKey - Micron Technology (NASDAQ: MU) currently stands at $1,213.56, retracing within an ascending channel on the 4H timeframe after rallying +15.98% in the wake of its fiscal Q3 2026 results on June 24. Long-wicked red candles near the confluence of trendlines are evidencing buyers absorbing at this area, the RSI has eased off higher post-earnings levels to 57.38 neutral-bullish, and the EMA200 remains far below as a structural support at $837.76. With markets closed over the weekend, this is the time to step back from short-term price action and review what the Q3 results told us and what we can expect from the week of June 30 to July 3 that may re-rate the name in either direction.
Micron’s Q3 Results: What The $41.5 Billion Revenue And $50 Billion Guidance Told Us
Micron’s Q3 2026 fiscal year results were incredible by any standard: $41.46 billion revenue +346% y/y, GAAP EPS of $25.11 (+23.8% vs. $20.28 consensus), and GAAP gross margin of 84.6% vs. 37.7% y/y. With the Q4 revenue guidance of $50 billion at 86% gross margins, the current strength in demand is not cyclical but rather accelerating sequentially. With no price action to focus on this weekend, it’s worth reflecting on three takeaways from those figures.
- Micron HBM capacity in 2026 under multi-year agreements at fixed prices was already sold out before the quarter began so the margin expansion is contracted and not spot-market dependent.
- Goldman Sachs put HBM and DRAM supply tightness in 2026 at 4.9%, the highest in 15 years.
- HBM4 is currently in high volume production at the lead customer and is at the sample stage at secondary customers. This isn’t a future roadmap but active revenue-generating production.
The $50 billion guidance is an amount well exceeding total annual FY 24 revenue for Micron. The strategic multi-year customer agreements with revenue guidance to FY26-27 that accompanied those figures are management’s way of extending the contract-based revenue model out into FY27 and beyond as they attempt to transition the traditionally cyclical spot-based market into one that resembles more contract-based revenue. Whether that shift is permanent will be the key question the following quarters will answer. The current pullback to $1,213 is the market digesting the incredible Q3 print and waiting to see the Q4 guidance hit.
What to Watch in the Week of June 30 to July 3
There are three major economic releases this week that directly impact how Micron will open on Monday morning. The first and most important is May's Core PCE inflation print. This number is the Fed's preferred inflation metric; and with Jerome "Warsh" keeping rates at their current level during the FOMC meeting on June 16 to 17, stating April CPI came in at 3.8% headline and 4.1% core, a softer PCE number is the most important macro event for providing a broader tailwind to tech stocks heading into Q3 earnings season. Conversely, if the PCE data prints higher, it gives ammunition to the Warsh Fed's caution and ensures the multiple compression headwind which has been a factor throughout May persists.
The June manufacturing PMI data will serve as a secondary read on whether the AI infrastructure buildout's demand pull-through is broadening. While Micron's auto and industrial end markets are smaller end markets in relation to Data Centre HBM, a PMI report suggesting manufacturing growth is consistent with AI deployment starting to spur demand that is broader than the hyperscaler AI buildout itself. Finally, any commentary on memory pricing from channel checks or industry analyst updates throughout the week will be the most Micron-specific data point we have leading into the fiscal Q4 earnings release later this month. A Q4 record of $24.4B net cash on-hand (record) provides all the liquidity needed through any near-term volatility in markets.
MU Technical Setup Into the New Week — Trendline at $1,213, Targets $1,244 and $1,321
On the 4-hour timeframe, Micron is trading at $1,213.56, testing an ascending black trendline while long red candles with lower wicks are confirming absorption at the support zone. The 200-EMA at $837.76 sets the macro baseline and the trendline is the next line of defense. The RSI (Relative Strength Index) is at a neutral-bullish 57.38 and there's room to grow. There is no RSI divergence on this higher timeframe either; this is controlled consolidation after a post-earnings surge and not an aggressive distribution of the stock.
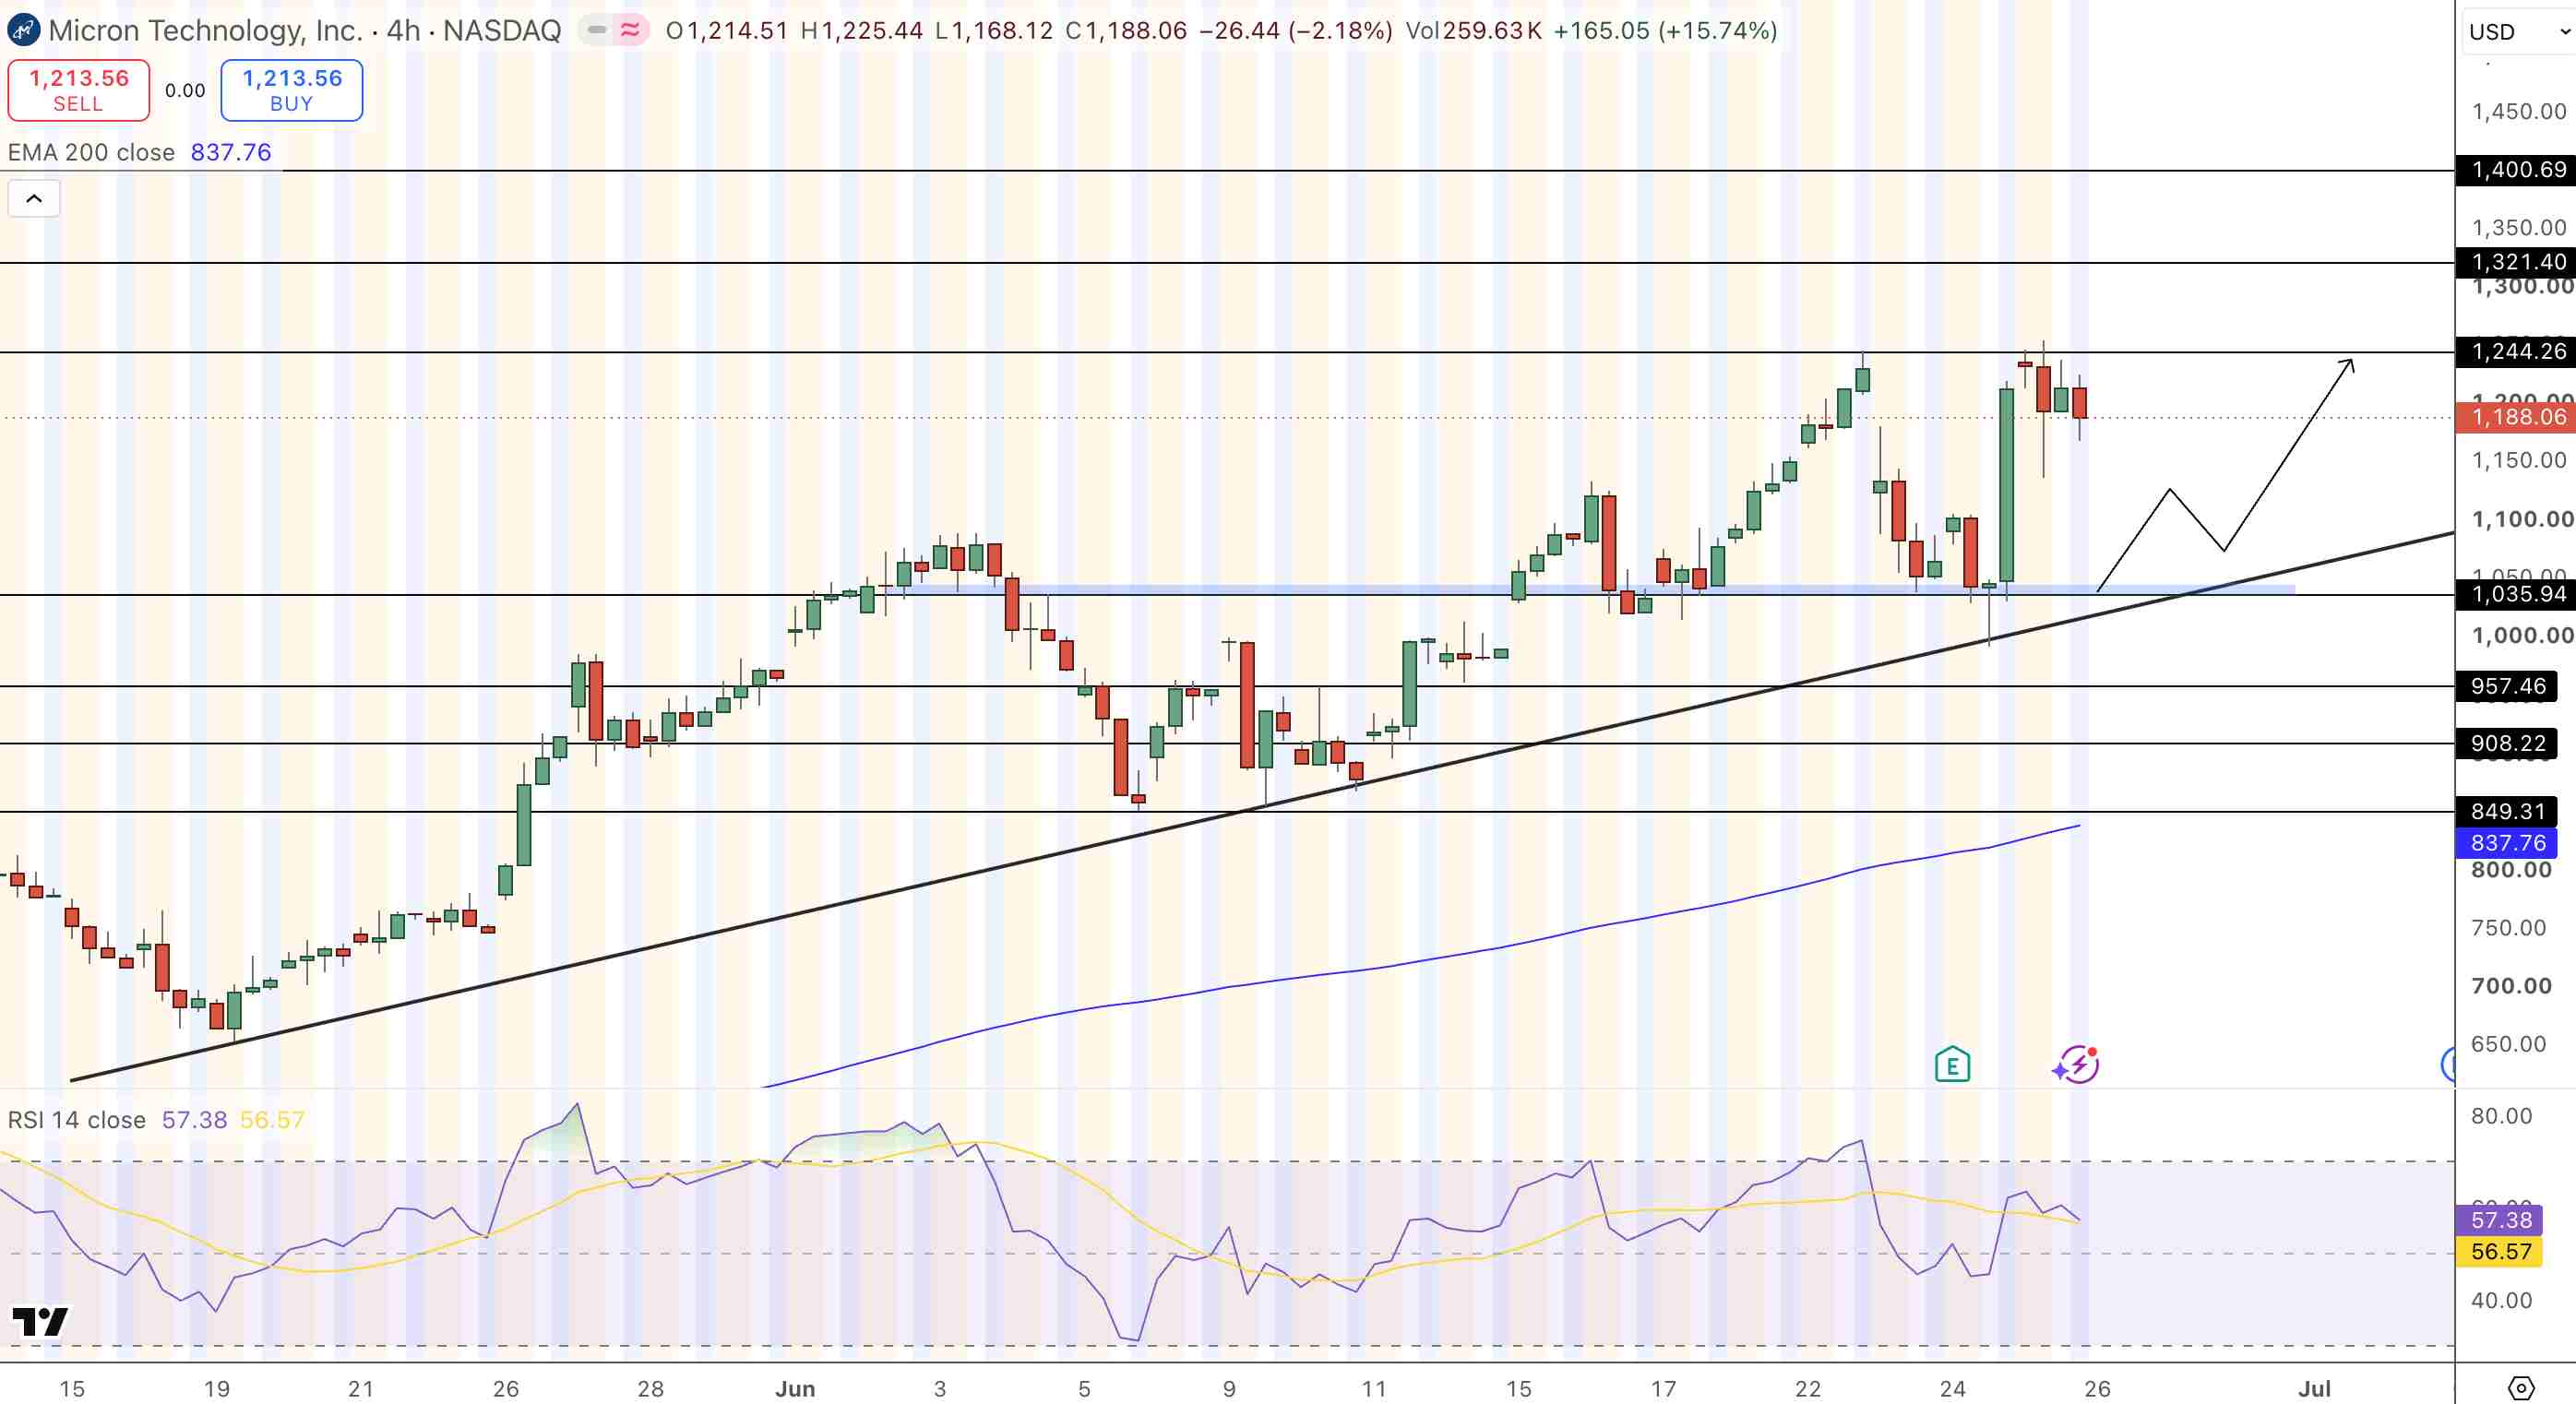
Micron (MU) Price Chart - Source: Tradingview
From this channel, there's scope to continue upward to the $1,244 to $1,321 range if the trendline holds. Holding the trendline this week should provide the platform for a test of the $1,244 resistance breakout on Monday when trading opens. On the downside, should the trendline break, support is clustered from $1,035 to $1,100.
- Entry: Long above $1,244 — channel resistance cleared
- Target: $1,321 — channel extension
- Trendline support: ~$1,200–1,213 — must hold over the weekend
- Stop Loss: Close below $1,035 — prior resistance now support
- Key macro: Core PCE (May) — week of June 30; manufacturing PMI
- Q4 guidance: $50B revenue, 86% gross margin, EPS $31 ±$1
What Did Micron Report That Drove the 15.98% Surge?
So, what was it that Micron released to cause its 15.98% increase? Micron reported a Q3 of 2026 revenue number of $41.46 billion, which was a massive 346% increase year over year and a robust 74% quarter over quarter increase. Micron came in $6.21 billion above the $35.25 billion consensus number to achieve its $41.46 billion result.
The company reported a non-GAAP earnings per share number of $25.11, which beat expectations by 23.8% to the consensus of $20.28. In fact, GAAP gross margins were also higher than the prior-year period, climbing significantly to 84.6% from 37.7%. In addition, management said that HBM4 was beginning high-volume manufacturing for its primary customer.
Micron provided Q4 2026 guidance, setting revenue targets at $50 billion, plus or minus $1 billion, gross margin at 86%, and non-GAAP earnings per share at $31.00. Management also stated it had secured multiple multi-year strategic customer agreements to provide revenue visibility in the future.
Bottom Line
Micron's MU decline to $1,213 from the +15.98% after-market surge is normal consolidation in a stock that just reported historic Q3 2026 results (i.e., $41.46 billion revenue up 346% YoY, 84.6% gross margin, $25.11 EPS beating the consensus by 23.8%, Q4 2026 guidance of $50 billion at 86% gross margin). The fact that the current decline is respecting the uptrend line, has an RSI of 57.38, and features long lower wicks tells us that buyers are actively defending the ascending trend channel at this time.
When the market re-opens next week, the main macro event worth a close look would be this month's May PCE inflation report. Anything softer than expected removes the multiple compression headwind, thus giving MU a favorable backdrop in which to target a follow-through breakout above $1,244 next week.
The $1,321 price point will be a logical next stop if that breakout is confirmed. A trailing stop can be placed just below $1,035 in order to capture the bulk of this channel move. Micron's contracted HBM supply structure and multi-year Strategic Customer Agreements make the argument that MU is anything other than a one-quarter earnings pop in my estimation.
Recommended Articles


Comments (0)
Click the $ button, enter the symbol, and select to link a stock, ETF, or other ticker.