

SpaceX Stock Is Down 30% From Post-IPO High: What Happens Next?


AI Podcast
SpaceX’s stock has experienced extreme volatility since its June 12 IPO, surging to a $3 trillion market cap before correcting over 30% from its peak. This decline followed the announcement of significant debt issuance for Starlink and xAI capital expenditures, which exacerbated concerns regarding Q1 net losses. Despite short-term pressure from valuation reassessments and pending lock-up expirations, Wall Street remains broadly optimistic, with a consensus "Buy" rating. Investors are now focused on upcoming quarterly earnings and Starship launch milestones to determine whether the company functions as a high-growth technological monopoly or a cash-burning entity.
TradingKey - SpaceX ( SPCX) has been listed for two weeks since June 12. In just over a dozen trading days, this largest-ever IPO has made massive waves in the secondary market. From a frenzied rush to acquire shares that pushed its market capitalization to $3 trillion, to a sudden onslaught of negative news driving a single-day drop of over 16%, SpaceX has staged a textbook frenzy of faith and subsequent valuation correction. Currently, SpaceX's stock price has fallen by over 30% from its post-IPO all-time high of $225.64.
Core Data at a Glance: SpaceX's Post-IPO Performance
SpaceX's IPO price was $135 per share, corresponding to an initial valuation of approximately $1.77 trillion and total proceeds of $75 billion upon its listing on Nasdaq. Following the listing, SpaceX's underwriters exercised their over-allotment option, bringing the final fundraising size to $85.7 billion and once again setting a new record for the largest IPO in history.
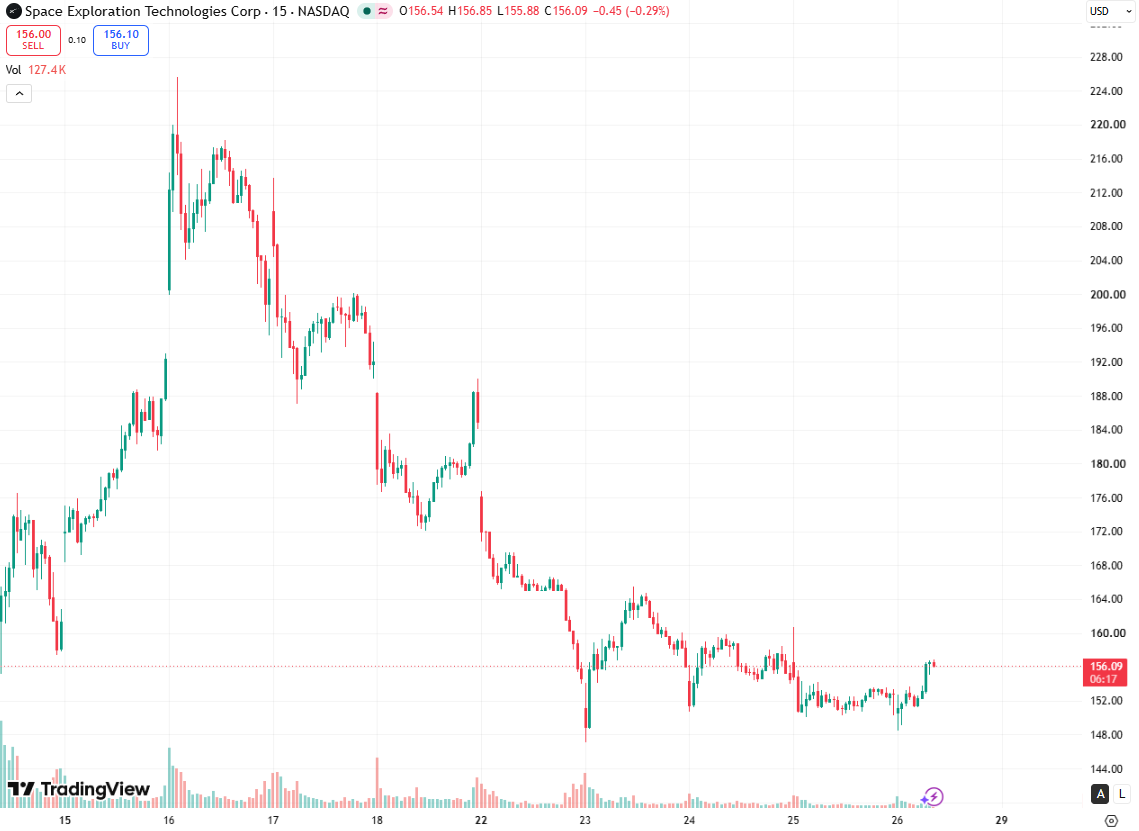
[Source: TradingView]
Upward Phase: Three trading days from June 12 to June 16
Trading Date | Listing Stage | Opening Price | Daily High | Closing Price | Single-Day Change | Closing Market Cap |
June 12 | First Day of Listing | $150.00 | $176.52 | $160.95 | 19.22% | $2.1 trillion |
June 15 | Second Day of Listing | $171.74 | $193.00 | $192.50 | 19.60% | $2.52 trillion |
June 16 | Third Day of Listing | $200.51 | $225.64 | $201.80 | 4.83% | $2.66 trillion |
Overall, the stock surged frantically during the first three days of listing. The main driver of the buying frenzy was the high retail allocation ratio, with reportedly about 20% of the shares allocated to retail investors, far exceeding the traditional single-digit IPO convention. Furthermore, the dominant market trading logic revalued it from a 'single aerospace manufacturer' to a 'multi-platform infrastructure monopolist' (Starlink broadband + xAI underlying computing protocol).
Downward Phase: Three trading days from June 17 to June 22
Trading Date | Listing Stage | Opening Price | Daily Low | Closing Price | Single-Day Change | Closing Market Cap |
June 17 | Fourth Day of Listing (First Day of Decline) | $209.84 | $187.01 | $191.82 | -4.95% | $2.46 trillion |
June 18 | Fifth Day of Listing | $188.39 | $172.11 | $185 | -3.56% | $2.27 trillion |
June 22 | Sixth day of trading (plunge on heavy volume) | $176 | $154 | $154.60 | -16.43% | $2.04 trillion |
Overall, the wild frenzy of the first three trading days came to an abrupt halt after hitting a historic high of $3 trillion, followed by a sharp valuation correction to deflate the bubble.
The direct core event triggering the stock's continuous deep plunge was the company's sudden weekend disclosure of a larger-than-expected debt issuance plan—SpaceX intends to issue senior unsecured bonds to cover the massive capital expenditures of Starlink and xAI. This shattered the market's optimistic illusions regarding its cash flow, forcing capital to re-examine its massive $4.28 billion net loss in the first quarter.
At the same time, research firms such as CFRA issued bearish reports at critical junctures, pointing out that its valuation had severely deviated from fundamentals and setting a bearish price target of $115. This, combined with defensive selling by investors ahead of the early lock-up release of 20% of employee shares following the second-quarter earnings report, collectively accelerated the stock's downward spiral.
SpaceX Market Outlook
SpaceX shares have consolidated within their IPO price range for three consecutive trading days, reflecting strong market wait-and-see sentiment as investors await the next core catalyst.
Based on the upcoming event window, second-quarter earnings are undoubtedly the most highly anticipated milestone. Although SpaceX has not officially scheduled its first quarterly report since going public, the market widely expects a release between late July and early August.
Potential upside catalysts include:
Short-term outlook | Potential upside catalysts | 1. First post-IPO earnings release; 2. Next Starship launch; 3. Securing major orders / partnerships |
Potential downside risks | 1. Valuation mean-reversion pressure; 2. Broader tech sector volatility; 3. Cooling of IPO sentiment | |
Key metrics to watch | 1. Starlink subscriber growth; 2. Starship launch success rate; 3. Quarterly revenue guidance | |
Medium- to long-term outlook | Core growth thesis | 1. Starship commercialization, significantly driving down space launch costs and reshaping the industry pricing system; 2. Starlink completing its global commercialization, becoming a stable cash flow engine |
Impact on industry landscape | Leveraging technological and cost advantages to continuously reshape the global commercial space and satellite internet landscape, building a deep first-mover moat | |
Valuation assessment | Valuation can be modeled by segmenting business lines such as launches and satellite internet; while long-term market capitalization has substantial upside, it remains critical to monitor the pace of commercialization and profitability timeline |
Despite experiencing a sharp shakeout and pullback post-IPO, Wall Street remains broadly optimistic about SpaceX's long-term value.
Currently, six brokerages cover the stock, with a consensus rating of 'Buy'.
In terms of the rating distribution, the bulls hold the upper hand, with three institutions issuing 'Buy' ratings. This indicates that most key Wall Street analysts remain firmly convinced of SpaceX's monopoly status as a hard-tech infrastructure giant.
Two institutions have issued 'Hold' ratings, reflecting a shift to defensive wait-and-see mode among some investors in light of larger-than-expected debt offering plans and lock-up expiration pressures.
One institution has assigned a 'Sell' rating, representing a minority bearish voice on the street that is highly concerned about the company's massive net losses and capital expenditures.
The average 12-month price target on Wall Street stands at $222.20, representing a substantial potential upside of 47.02% from the current price of around $151.
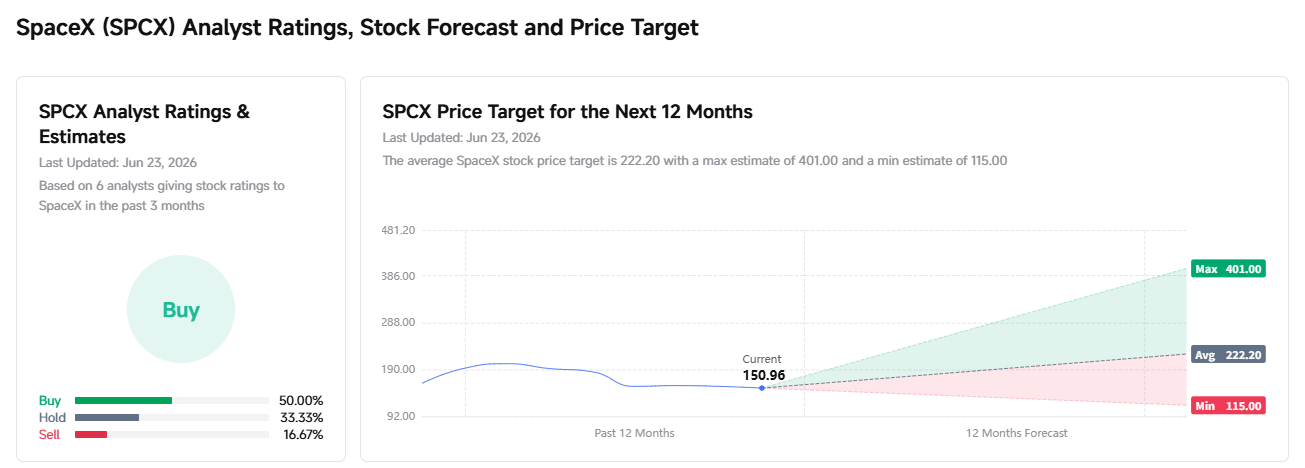
[Source: FutuBull]
Notably, bulls and bears remain sharply divided over the stock's future valuation. The most optimistic bull-case target is set at a whopping $401, based on the thesis that if SpaceX successfully weathers the upcoming wave of lock-up expirations, and Starlink's global commercialization and profitability beat expectations—further bolstered by massive computing infrastructure revenue from its tight integration with xAI—the stock could break out strongly above its previous highs.
Conversely, the most pessimistic bear-case target is $115. Analysts behind this target are clearly concerned that if the company's high cash burn rate spins out of control, subsequent debt offerings face hurdles, or a massive wave of employee stock sales triggers a panic, the stock could undergo a disastrous valuation deflating, plunging below its IPO price of $135.
In summary, the vast gulf between the extreme targets of $401 and $115 proves that SpaceX is far from a traditional linear growth stock. Rather, it is a high-profile battleground where Wall Street capital debates two extreme narratives: a 'cash-burning machine' versus a 'technological monopoly.' Despite intense short-term shakeout pressure, as long as the grand, long-term growth thesis of the three bullish brokerages remains intact, the average price of $187.80 should still act as a strong support level for institutional money.
This content was translated using AI and reviewed for clarity. It is for informational purposes only.
Recommended Articles


Comments (0)
Click the $ button, enter the symbol, and select to link a stock, ETF, or other ticker.