

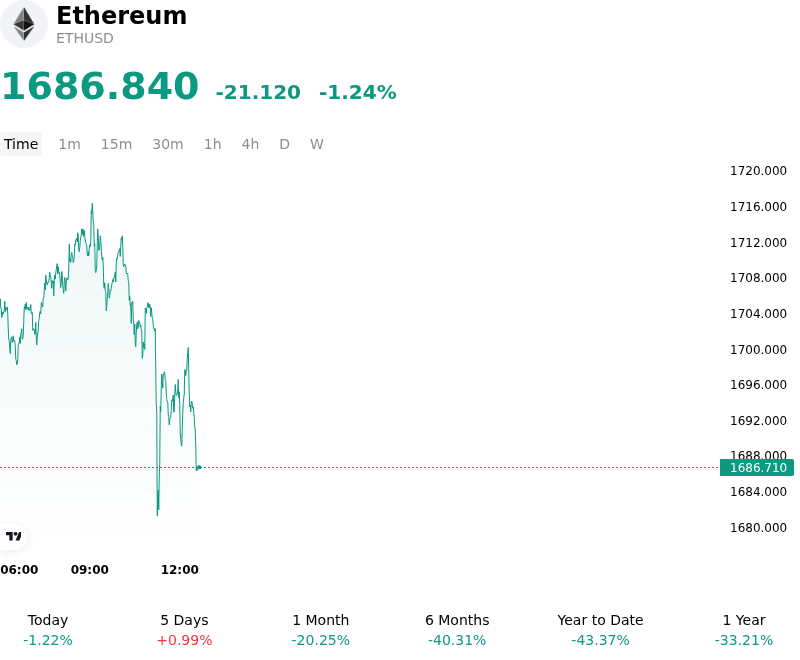
Ethereum (ETHUSD) Suddenly Goes down 1.24% on Jun 19: What's Driving This

Ethereum (ETHUSD) is down 1.24% at Jun 19 00:40(ET), now at $1686.84, with a 7-day up of 1.42%.
What is driving Ethereum (ETHUSD)’s stock price down today?
Ethereum's downward trajectory reflects a combination of macroeconomic headwinds, fading institutional interest, and a weak technical structure. The primary catalyst driving the asset's decline is a significant hawkish shift in monetary policy expectations. Following the debut of a hawkish Federal Reserve outlook, which signaled that interest rates will remain restrictive for longer and even left the door open for potential hikes, the macroeconomic tailwinds that previously supported risk assets have evaporated. Restrictive monetary policy and elevated risk-free yields have continued to drain liquidity from speculative markets, prompting institutional allocators to de-risk and reduce their exposure to digital assets.
This macro-driven risk aversion has manifested directly in capital flows, particularly within the spot exchange-traded fund space. Rather than providing structural support, spot Ethereum ETFs have faced a wave of net outflows and stagnant demand. The lack of persistent institutional inflows has forced the market to rely heavily on retail liquidity, which remains highly defensive. Without consistent spot purchasing power from institutional products, the asset has struggled to absorb systematic selling pressure from larger market participants.
On-chain metrics and structural trends further compound the pressure. Within the Ethereum ecosystem, the absence of a singular, high-conviction catalyst has kept network activity and fee-generation muted. With decentralized finance activity and other on-chain demand drivers leveling off, transaction volumes have done little to inspire confidence. This fundamental stagnation has translated to a weak technical setup, with the price remaining trapped below key short-term and medium-term moving averages. When an asset consistently trades beneath its key exponential moving averages, it invites systematic short positioning and discourages leveraged longs from defending support levels, ultimately leading to orderly spot liquidations.
Finally, broader cryptocurrency market dynamics have exacerbated Ethereum's struggles. With the overall market capitalization contracting and market sentiment metrics lingering in extreme fear territory, investor risk appetite is severely depressed. Geopolitical tensions and broader global uncertainties have further reinforced a flight to safety, with capital rotating out of smart-contract platforms and back into capital-preservation vehicles. As long as the market must contend with a hawkish central bank and defensive institutional posture, Ethereum is likely to face sustained resistance to any near-term structural recovery.
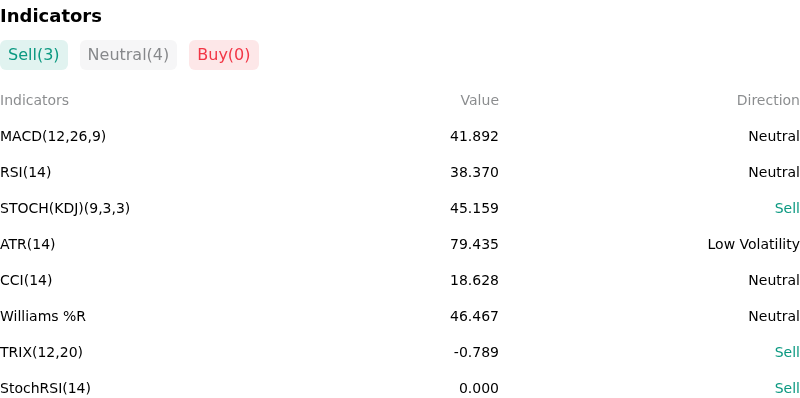
Technical Analysis of Ethereum (ETHUSD)
Technically, Ethereum (ETHUSD) shows a MACD (12,26,9) value of 41.892, indicating a neutral signal. The RSI at 38.370 suggests neutral condition and the Williams %R at 46.467 suggests neutral condition. Please monitor closely.
More details about Ethereum (ETHUSD)
Recent Events and Risks:
- **Sustained Institutional Capital Outflows from Spot ETFs:** U.S. spot Ethereum ETFs remain a dominant source of selling pressure, suffering an additional $29.37 million net outflow on June 17, 2026, led by Grayscale and BlackRock's ETHA. This resumes the negative momentum of a record 17-consecutive-day outflow streak in early-to-mid June and $401 million in net redemptions in May, forcing fund issuers to liquidate underlying ETH holdings into thin spot markets.
- **Derivatives Liquidity Drain and Breakdown Risks:** Ethereum derivatives indicators have cratered, with options open interest dropping to a multi-month low of $5.5 billion (down from its $8.5 billion peaks) and perpetual funding rates sliding. Extreme compression on technical volatility metrics (such as the BBWP) indicates an impending, violent price move, with prediction markets like Polymarket and Kalshi currently pricing a 73%–76% probability of ETH collapsing to $1,500.
- **Glamsterdam Upgrade Delay and L2 Revenue Cannibalism:** Market sentiment has weakened following the delay of Ethereum's next major hard fork, "Glamsterdam," from its expected June target to late Q3 2026. This delay prolongs the network's vulnerability to Layer 2 fee cannibalism, which continues to divert transaction revenues away from the L1 mainnet, severely limiting near-term value accrual to ETH.
- **Tightening Global Liquidity via Hawkish Central Bank Signals:** Ethereum faces severe macro-driven capital flight following the Federal Reserve's June 17, 2026 meeting, which held rates steady but flashed hawkish "dot plot" signals for a potential rate hike later this year. Coupled with the European Central Bank's 25-basis-point rate hike on June 15, tightening global monetary policy is strengthening the U.S. Dollar and draining the liquidity required to support risk-on digital assets.
This article may include AI-generated content that is human-reviewed, which is for reference and general information purposes only and does not constitute investment advice.
Recommended Articles


Comments (0)
Click the $ button, enter the symbol, and select to link a stock, ETF, or other ticker.