

2026 Silver Price Forecast: US-Iran Conflict May End, Can Silver Return Above $100 This Year?


AI Podcast
Silver prices reached $69.60 on June 17, supported by a technical double-bottom pattern and optimism surrounding US-Iran peace talks. Easing geopolitical tensions reduced crude oil prices and inflationary pressures, tempering Federal Reserve rate hike expectations and weakening the US dollar. Despite this momentum, significant policy uncertainties remain. Long-term support is underpinned by a structural supply deficit, with a forecasted 67-million-ounce shortage by 2026. Technically, silver faces immediate resistance at $74.80; a sustained breakout could target $90–$92, while failure to clear this hurdle risks a retest of the $62.00 support level.
TradingKey - Recently, silver prices ( XAGUSD) after once again touching the vicinity of $62.00, continued to rebound driven by expectations of US-Iran peace talks, briefly surging to $70 this week. As of the European session on June 17, silver prices hovered and consolidated around $69.60, though technical analysis reveals a double-bottom pattern on the weekly chart, which may support a continued rise in silver prices.
Expectations of US-Iran peace talks support the continuous rise in silver prices, while a supply deficit provides medium- to long-term support.
From a fundamental perspective, the biggest factor dominating silver price movements recently remains the US-Iran situation.
According to the latest reports, details of a temporary peace framework between the US and Iran are gradually emerging. The core elements of the agreement include extending the previously fragile ceasefire arrangement to buy time for subsequent permanent ceasefire negotiations; the US potentially lifting the blockade on Iranian ports and allowing Iran to resume oil sales; and Iran allowing tankers to pass through the Strait of Hormuz once again. Given the Strait of Hormuz's immense impact on global energy supplies, once the corridor is restored, market concerns over crude oil supply disruptions will ease significantly.
Spurred by the news, the crude oil market fell for six consecutive trading days. WTI (USOIL) crude surrendered the $80 threshold, with a cumulative decline of over 17%, while Brent crude also broke below the $80 mark, recording a cumulative drop of over 16%. The pullback in oil prices eased inflationary pressures and lowered market expectations for further Federal Reserve rate hikes; the weakening of the US dollar and US Treasury yields subsequently lent support to silver prices.
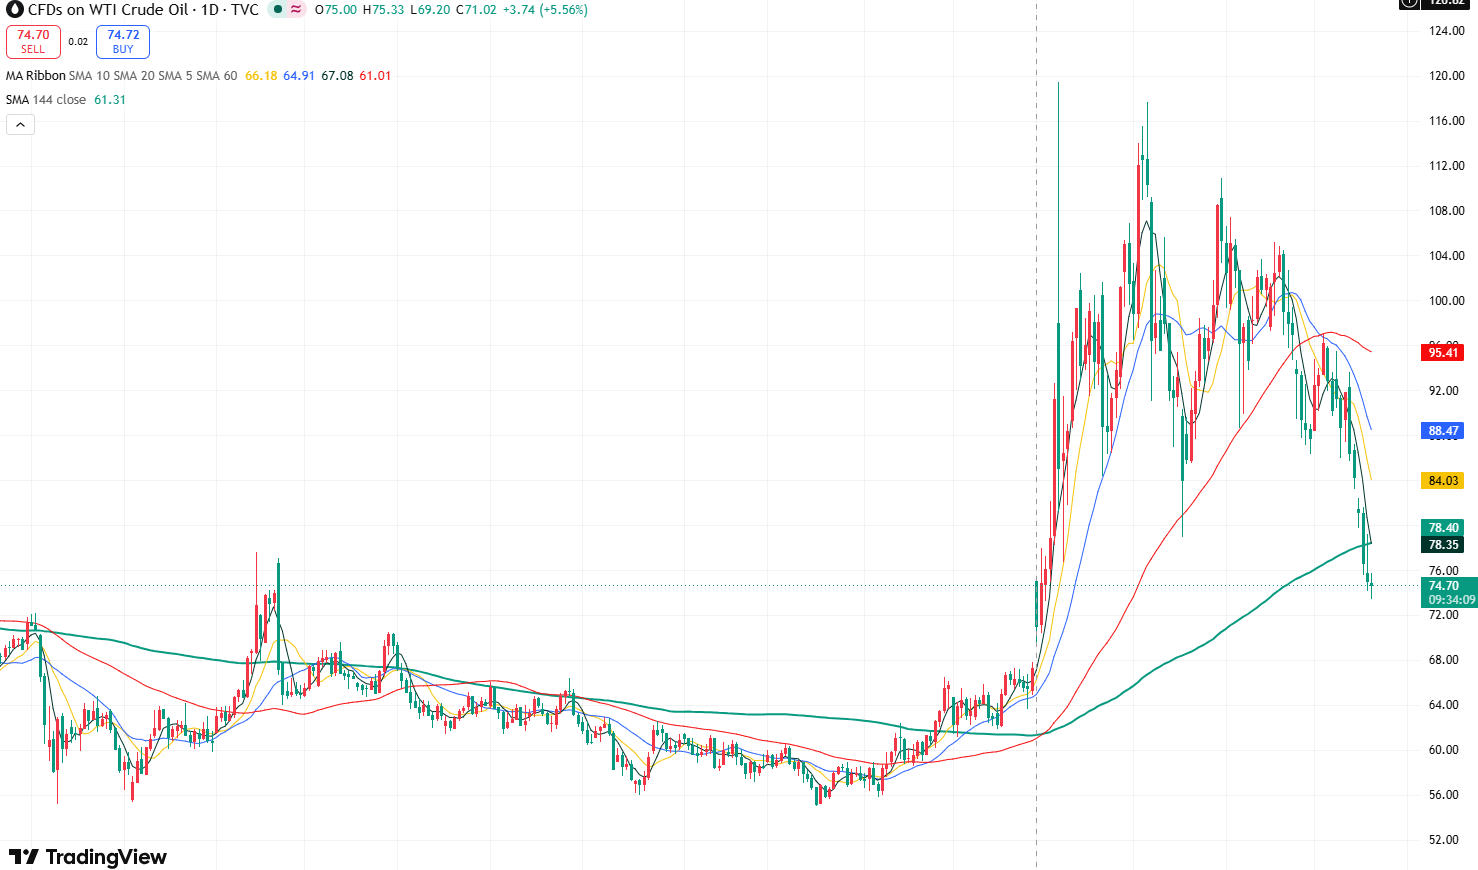
WTI Crude Oil Price Daily Chart, Source: TradingView
It should be noted that uncertainties remain regarding this agreement. Although Trump claimed the agreement has been signed and stated that the text would be released soon, the market is still awaiting official documents and execution details. Whether Iran can truly resume oil exports, whether shipping through the Strait of Hormuz is fully restored, and whether Israel accepts this framework will all determine whether geopolitical risks are genuinely receding.
In the long run, besides the US-Iran situation, silver's own supply and demand dynamics also warrant attention. The silver market has been in a supply deficit for several consecutive years. The Silver Institute forecasts a silver shortage of approximately 67 million ounces in 2026, with physical inventory depletion providing medium- to long-term support for silver prices. This suggests that amid high macroeconomic uncertainty and investors seeking alternatives to gold, there remains capital allocation demand for silver.
Silver Price Analysis: Weekly Double Bottom Pattern Formed, May Support Continued Rally
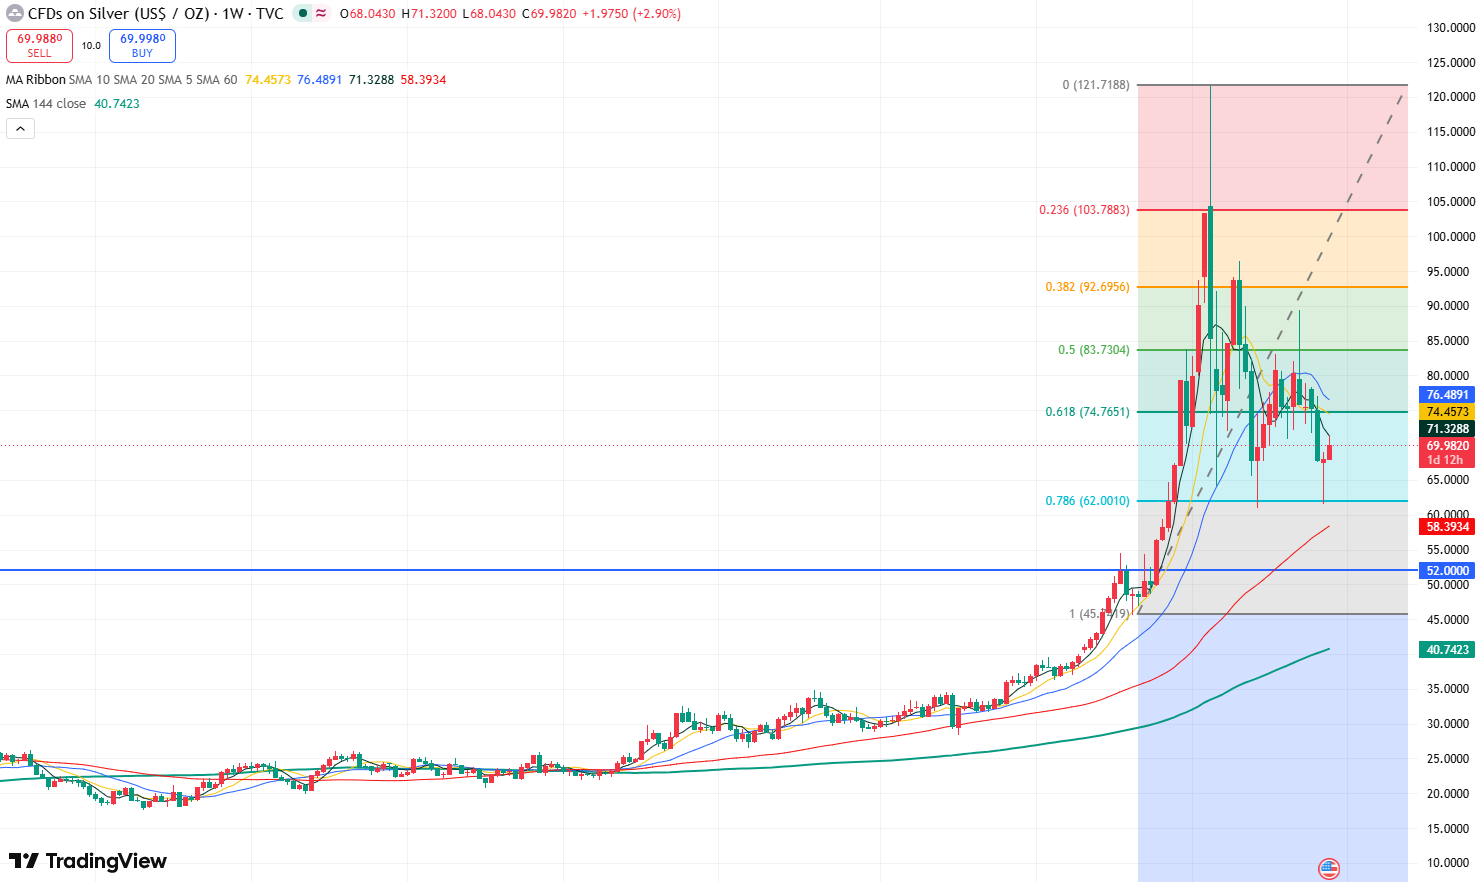
Weekly silver price chart, Source: TradingView
Looking at silver's weekly chart, the candlestick closed last week as a red Doji star with a long lower shadow, indicating robust support below. At the same time, the overall candlestick structure forms a double bottom pattern, further boosting bullish momentum. Consequently, silver prices are poised for a technical corrective rally.
Currently, silver prices face immediate resistance at the Fibonacci 0.618 retracement level of $74.80. If silver can effectively break and hold above this level, the upside potential toward $90-$92 will open up. A further breakthrough above the March high of $96.40 would open the upside toward $100.
Conversely, if silver remains under pressure below the $74.80 resistance, prices may retest the $62.00 support level in the short term. If this level is breached, silver will enter a deeper correction phase, potentially declining to the support level of $52.00.
This content was translated using AI and reviewed for clarity. It is for informational purposes only.
Recommended Articles


Comments (1)
Click the $ button, enter the symbol, and select to link a stock, ETF, or other ticker.