

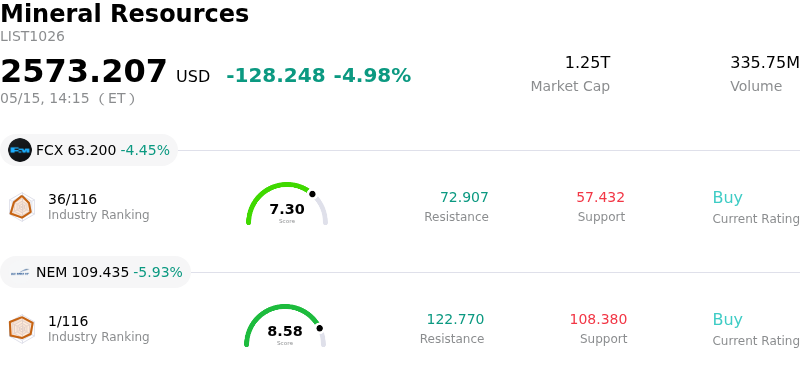
Newmont Corporation Stock (NEM) Moved Down by 5.93% on May 15: A Full Analysis

Newmont Corporation (NEM) moved down by 5.93%. The Mineral Resources sector is down by 4.98%. The company underperformed the industry. Top 3 stocks by turnover in the sector: Freeport-McMoRan Inc (FCX) down 4.45%; Newmont Corporation (NEM) down 5.93%; Barrick Mining Ord Shs (B) down 5.46%.
What is driving Newmont Corporation (NEM)’s stock price down today?
The decline in Newmont Corporation's stock today appears to be primarily driven by a significant pullback in precious metals prices, particularly gold. Gold fell sharply on May 15, 2026, dropping about 1.91% to $4562.41 USD/t.oz from the previous day, and was on track to fall about 4% for the week. Some reports indicate a decline of as much as 3% in spot gold towards the $4,500/oz level during intraday trading. This downturn in gold prices is attributed to heightened inflation fears, which are leading to expectations of elevated interest rates or even further rate hikes by the Federal Reserve. Rising US Treasury yields and a stronger US dollar also weighed on gold, making non-yielding assets less attractive.
Gold mining stocks, including Newmont, are highly sensitive to the price of bullion. When gold prices fall, investors often reprice the near-term margins and profitability of mining companies, which can lead to a more pronounced percentage drop in their stock value compared to the commodity itself. Other precious metals like silver also experienced declines today, reinforcing a risk-off sentiment across the broader precious metals complex and mining shares. Geopolitical concerns, such as stalled US-Iran peace talks and ongoing tensions near the Strait of Hormuz, were also mentioned as contributing to investor panic selling in the gold and silver markets.
Despite the significant intraday decline, Newmont had recently reported strong financial performance for the first quarter of 2026, exceeding analyst expectations for both EPS and revenue. The company also announced record quarterly free cash flow and maintained its full-year production guidance. This suggests that today's stock movement is more broadly tied to commodity price dynamics and macroeconomic factors rather than specific negative company-centric news. Some insider selling activity has been noted over the past several months, but recent institutional investor filings showed some firms increasing their positions in Newmont during Q4. However, the primary catalyst for today's price reduction appears to be the broader retreat in gold prices due to inflation concerns and strengthening dollar and yields.
Technical Analysis of Newmont Corporation (NEM)
Technically, Newmont Corporation (NEM) shows a MACD (12,26,9) value of [0.62], indicating a buy signal. The RSI at 52.92 suggests neutral condition and the Williams %R at -34.26 suggests oversold condition. Please monitor closely.
Fundamental Analysis of Newmont Corporation (NEM)
Newmont Corporation (NEM) is in the Mineral Resources industry. Its latest annual revenue is $22.67B, ranking 8 in the industry. The net profit is $7.08B, ranking 3 in the industry. Company Profile
Over the past month, multiple analysts have rated the company as Buy, with an average price target of $141.97, a high of $205.00, and a low of $64.32.
More details about Newmont Corporation (NEM)
Company Specific Risks:
- Newmont's revenue and cash flow are highly sensitive to fluctuations in gold prices, which are currently retreating due to higher U.S. yields and a firmer dollar, potentially repricing near-term margins for the company.
- Recent insider selling activity, such as David John Thornton's sale of shares on May 1st, 2026, and David James Fry's sale on March 16th, 2026, indicates a decrease in their respective positions, which could be interpreted as a lack of confidence by company executives.
- Some large institutional investors, including VIRGINIA RETIREMENT SYSTEMS ET Al and BlackRock, Inc., have recently reduced their holdings in Newmont, suggesting a potential shift in institutional sentiment.
This article may include AI-generated content that is human-reviewed, which is for reference and general information purposes only and does not constitute investment advice.
Recommended Articles


Comments (0)
Click the $ button, enter the symbol, and select to link a stock, ETF, or other ticker.