

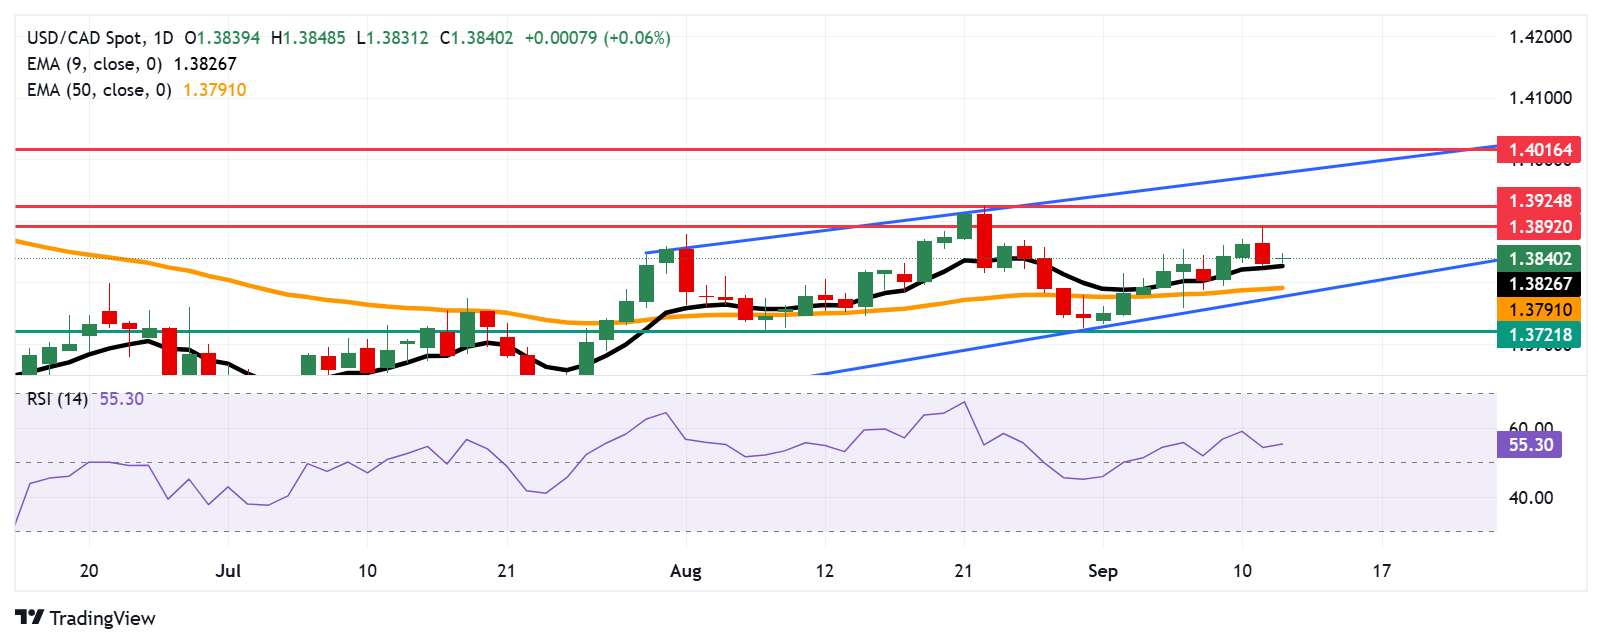
USD/CAD Price Forecast: Targets nine-day EMA support near 1.3800

- USD/CAD may find its initial barrier at the monthly high of 1.3892.
- The bullish bias is still stronger as the 14-day RSI is positioned slightly above the 50 level.
- The pair falls toward immediate support at the nine-day EMA of 1.3826.
USD/CAD trades around 1.3830 during the European hours on Friday, remaining subdued after registering nearly a quarter-percent loss in the previous session. The technical analysis of the daily chart suggests that the pair moves sideways within an ascending channel pattern, indicating a persistent market bias.
The USD/CAD pair remains above the nine-day Exponential Moving Average (EMA), suggesting the short-term price momentum is still stronger. However, the 14-day Relative Strength Index (RSI) is still positioned slightly above the 50 level, indicating that bullish bias is in play.
On the upside, the USD/CAD pair may target the monthly high of 1.3892, which was recorded on September 11, followed by the four-month high at 1.3924, reached on August 22. A break above the latter would support the pair to test the upper boundary of the ascending channel around 1.3980. Further advances above the channel would strengthen the bullish bias and lead the pair to approach the five-month high at 1.4016, reached on May 13.
The immediate support appears at the nine-day EMA of 1.3826. A break below this level would weaken the short-term price momentum and prompt the USD/CAD pair to test the 50-day EMA at 1.3791, followed by the ascending channel’s lower boundary around 1.3780. Further declines below the channel would cause the emergence of the bearish bias and put downward pressure on the pair to navigate the region around the two-month low of 1.3721, which was recorded on August 7.
USD/CAD: Daily Chart
Canadian Dollar Price Today
The table below shows the percentage change of Canadian Dollar (CAD) against listed major currencies today. Canadian Dollar was the strongest against the Japanese Yen.
| USD | EUR | GBP | JPY | CAD | AUD | NZD | CHF | |
|---|---|---|---|---|---|---|---|---|
| USD | -0.05% | 0.07% | 0.18% | 0.05% | -0.02% | 0.13% | 0.02% | |
| EUR | 0.05% | 0.12% | 0.21% | 0.11% | 0.05% | 0.18% | 0.07% | |
| GBP | -0.07% | -0.12% | 0.08% | -0.02% | -0.10% | 0.07% | -0.03% | |
| JPY | -0.18% | -0.21% | -0.08% | -0.10% | -0.18% | -0.08% | -0.18% | |
| CAD | -0.05% | -0.11% | 0.02% | 0.10% | -0.03% | 0.09% | -0.02% | |
| AUD | 0.02% | -0.05% | 0.10% | 0.18% | 0.03% | 0.17% | 0.03% | |
| NZD | -0.13% | -0.18% | -0.07% | 0.08% | -0.09% | -0.17% | -0.11% | |
| CHF | -0.02% | -0.07% | 0.03% | 0.18% | 0.02% | -0.03% | 0.11% |
The heat map shows percentage changes of major currencies against each other. The base currency is picked from the left column, while the quote currency is picked from the top row. For example, if you pick the Canadian Dollar from the left column and move along the horizontal line to the US Dollar, the percentage change displayed in the box will represent CAD (base)/USD (quote).
Recommended Articles


Comments (0)
Click the $ button, enter the symbol, and select to link a stock, ETF, or other ticker.