S&P Global Inc Stock (SPGI) Moved Down by 3.56% on Apr 9: Facts Behind the Movement

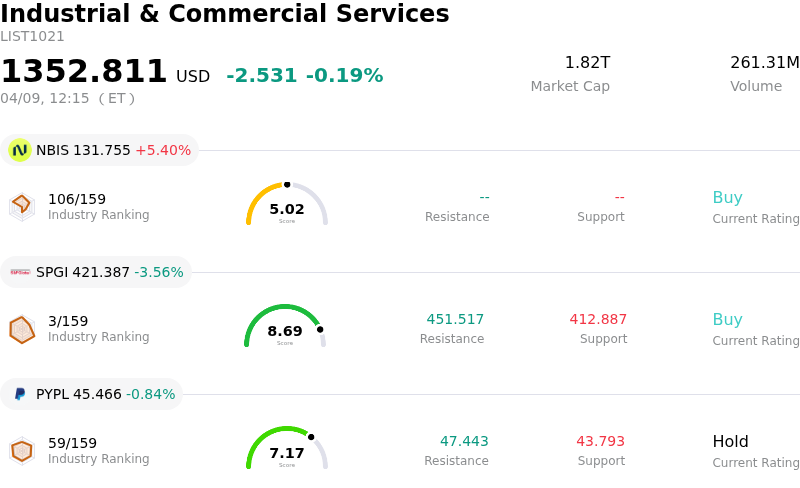
S&P Global Inc (SPGI) moved down by 3.56%. The Industrial & Commercial Services sector is down by 0.19%. The company underperformed the industry. Top 3 stocks by turnover in the sector: Nebius Group NV (NBIS) up 5.40%; S&P Global Inc (SPGI) down 3.56%; PayPal Holdings Inc (PYPL) down 0.84%.
What is driving S&P Global Inc (SPGI)’s stock price down today?
S&P Global Inc. (SPGI) experienced a notable intraday decline, primarily influenced by a continued market reassessment of its financial outlook for the current fiscal year. The company's adjusted earnings per share guidance for 2026, issued earlier this year, fell below analysts' consensus expectations, contributing to ongoing investor caution. While fourth-quarter revenue surpassed estimates, the slight miss on earnings per share in the previous quarter further solidified concerns regarding profitability.
This revised guidance and the modest earnings per share shortfall in the last reported quarter have led to adjustments in analyst forecasts. Several firms have recently lowered their price targets for S&P Global, indicating a recalibration of future valuation estimates. This re-evaluation by analysts can contribute to negative sentiment and influence share price movements.
Moreover, the market continues to monitor the planned spin-off of S&P Global's Mobility division, which is targeted for completion in mid-2026. Uncertainties surrounding this separation, including its eventual impact on the company's future growth and margin profile, may be contributing to investor apprehension. Broader market sentiment, characterized by a "risk-off" environment and heightened volatility, can also disproportionately affect companies like S&P Global, which operate in information services and are sensitive to credit cycles.
Additionally, concerns about AI-driven disruption within the software and services sector, where S&P Global operates, have been noted by analysts and may create underlying anxiety among investors. While not a direct catalyst for today's movement, these factors combine to create a challenging environment for the stock.
Technical Analysis of S&P Global Inc (SPGI)
Technically, S&P Global Inc (SPGI) shows a MACD (12,26,9) value of [-5.93], indicating a neutral signal. The RSI at 54.46 suggests neutral condition and the Williams %R at -13.05 suggests oversold condition. Please monitor closely.
Fundamental Analysis of S&P Global Inc (SPGI)
S&P Global Inc (SPGI) is in the Industrial & Commercial Services industry. Its latest annual revenue is $15.34B, ranking 8 in the industry. The net profit is $4.47B, ranking 2 in the industry. Company Profile
Over the past month, multiple analysts have rated the company as Buy, with an average price target of $540.58, a high of $629.00, and a low of $480.00.
More details about S&P Global Inc (SPGI)
Company Specific Risks:
- S&P Global issued a weaker-than-expected adjusted earnings per share (EPS) guidance for fiscal 2026 ($19.40-$19.65 vs. analyst expectations of $19.96), leading to a significant share price decline.
- The company's forecast of 6.0% to 8.0% organic constant currency revenue growth for 2026 represents a slowdown from the previous year, coupled with uncertainty surrounding the planned mid-2026 Mobility spin-off.
- Concerns persist regarding the disruptive potential of AI and large language models challenging traditional financial data subscription models, which may necessitate increased capital expenditure for S&P Global's technological adaptation.
- Recent issues around weak internal controls and uncorrected inaccuracies in sovereign risk reports, particularly concerning African countries, could undermine the credibility of S&P Global's rating services.
Recommended Articles