Albany International Corp Stock (AIN) Moved Down by 3.12% on Apr 2: Drivers Behind the Movement

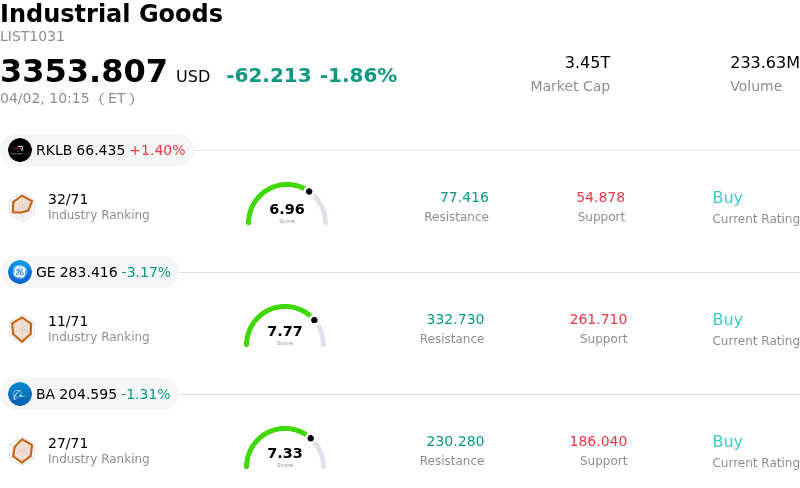
Albany International Corp (AIN) moved down by 3.12%. The Industrial Goods sector is down by 1.86%. The company underperformed the industry. Top 3 stocks by turnover in the sector: Rocket Lab USA Inc (RKLB) up 1.40%; General Electric Co (GE) down 3.17%; Boeing Co (BA) down 1.31%.
What is driving Albany International Corp (AIN)’s stock price down today?
The downward price movement for AIN today can be largely attributed to a continuation of cautious financial sentiment and ongoing operational challenges, despite some recent positive technical trading. The company's first-quarter 2026 earnings guidance was notably conservative, falling below analyst expectations for both earnings per share and revenue. This revised outlook has contributed to an underlying negative investor sentiment in prior weeks.
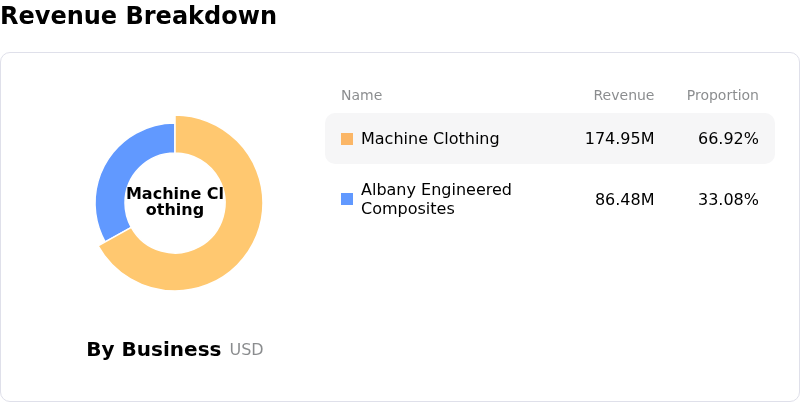
Further pressure stems from persistent operational headwinds. The Machine Clothing segment, a key area for Albany International, continues to experience revenue declines and volume pressure. This weakness is particularly pronounced in Asian markets, alongside strategic business exits in Europe, which collectively lead to decreased gross margins. An equipment failure at a North American Machine Clothing facility in January is also expected to unfavorably impact the company's first-quarter 2026 results.
Analyst sentiment surrounding AIN remains largely cautious. The stock currently holds an average rating of "Reduce," with a consensus that investors should reduce their holdings. Several analysts maintain a "Hold" rating, and some have recently reaffirmed "Sell" ratings, indicating a lack of strong conviction for future price appreciation. Additionally, the company's forecasted annual revenue growth rate is not expected to surpass the average for the US Textile Manufacturing industry. While the stock experienced an upward movement recently, this appears to have been a temporary rebound from oversold conditions rather than a sustained shift in fundamental outlook, allowing underlying concerns to resurface.
Technical Analysis of Albany International Corp (AIN)
Technically, Albany International Corp (AIN) shows a MACD (12,26,9) value of [-1.36], indicating a neutral signal. The RSI at 50.10 suggests neutral condition and the Williams %R at -18.69 suggests oversold condition. Please monitor closely.
Fundamental Analysis of Albany International Corp (AIN)
Albany International Corp (AIN) is in the Industrial Goods industry. Its latest annual revenue is $1.18B, ranking 95 in the industry. The net profit is $-57.34M, ranking 192 in the industry. Company Profile
Over the past month, multiple analysts have rated the company as Hold, with an average price target of $58.00, a high of $64.00, and a low of $55.00.
More details about Albany International Corp (AIN)
Company Specific Risks:
- Lower than anticipated Q1 2026 adjusted EPS and revenue guidance, partly due to an equipment failure at a North American Machine Clothing facility in January, is expected to unfavorably impact quarterly results.
- The Machine Clothing segment continues to face revenue declines and volume pressure, particularly from weakness in Asian markets, notably China, and strategic business exits in Europe, leading to decreased gross margins.
- Analyst sentiment indicates a cautious outlook for AIN, with a consensus "Reduce" rating as of March 17, 2026, reflecting concerns over profitability challenges and an anticipated 11.1% revenue decline over the next 12 months.
- Deterioration in profitability is evident with a significant 22.2 percentage point decrease in the company's operating margin over the last five years and a decline in Free Cash Flow Margin to 16% in Q4 2025 from 21% in the prior year.