


TradingKey - The tariff storm unleashed by Trump has stirred the global financial markets. On March 3, U.S. President Trump announced that a 25% tariff on imports from Mexico and Canada would take effect on the 4th.
In response to the tariffs imposed by the United States, Canadian Prime Minister Trudeau stated in a press release on March 3 that if the U.S. imposing tariffs on Canadian imports starting on the 4th, Canada will retaliate with a 25% tariff on around CAD 155 billion (approximately USD 107 billion) worth of American goods.
Of this, tariffs on CAD 30 billion of American goods will take effect on the 4th, while tariffs on an additional CAD 125 billion will go into effect in 21 days.
As a result of these tariffs, global forex markets have once again plunged into turmoil, with both the Canadian dollar and Mexican peso falling to approximately one-month lows against the U.S. dollar. On March 4, the USD/CAD exchange rate hit a one-month low of 1.45415, while USD/MXN dropped another 0.2% to reach $20.7390—its lowest level since February 3.
The forex market is like an ocean that is never calm; within its extreme volatility lie opportunities for multiplied gains as well as hidden reefs that pose risks. You might wonder: "Can I make quick profits during such times by chasing trends?" But seasoned traders know that in turbulent times, solid fundamentals are essential for stability. Today, we’ll delve into technical analysis and discuss how to use this "microscope" to understand market trends—keeping risks in check while seizing opportunities at every turn.
What Are Chart Patterns?
Chart patterns are the foundation of technical analysis in forex trading, serving as "traffic lights" for market trends.
By providing a visual representation of price movements, they help you assess the future direction of the market.
Chart patterns fall into two main classes: reversal patterns and continuation patterns.
- Reversal Patterns
Reversal patterns signal a potential change in trend, indicating that the market is about to shift from bullish to bearish or vice versa.
Head and Shoulders Pattern
This particular pattern has two variations: the head and shoulders top and the head and shoulders bottom.
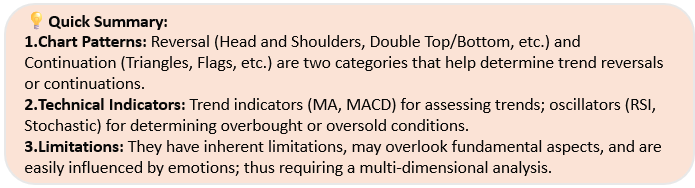
Head and Shoulders Top — The Twilight of Bulls
The head and shoulders top is a well-known reversal pattern that typically appears at the conclusion of an uptrend, resembling a person's shoulders and head.
Left Shoulder: The price surges to a peak before pulling back with significant volume. Although bulls are dominant, they show signs of fatigue.
Head: The price reaches a new high, but trading volume may not increase accordingly; this represents the last gasp from buyers.
Right Shoulder: The price rebounds but fails to match the height of the head, while volume significantly diminishes. Bears begin to take control.
Once the price breaks below the “neckline” (the horizontal line connecting the lows between the left shoulder and head), it signals that a downtrend has officially begun.
(Source: Wikipedia)
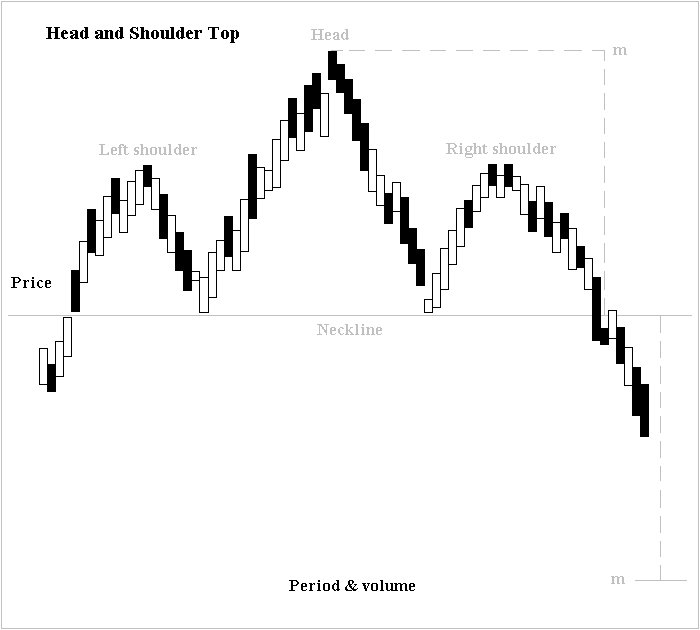
The inverse formation, known as Head and Shoulders Bottom, indicates an upcoming uptrend once prices break above the neckline; this suggests that buying opportunities should be considered.
(Source: Wikipedia)
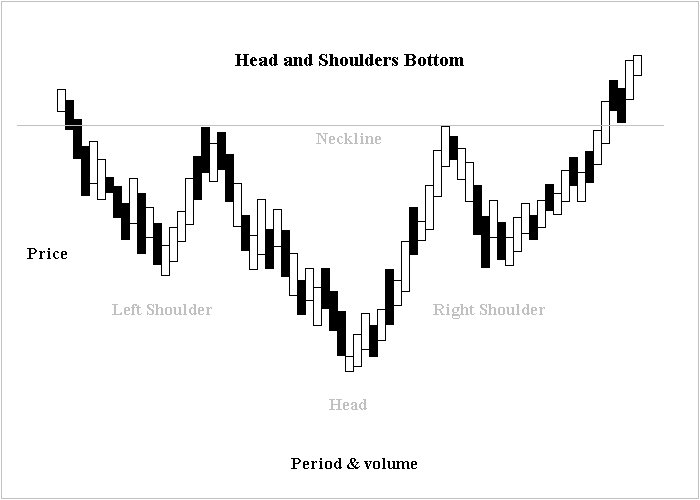
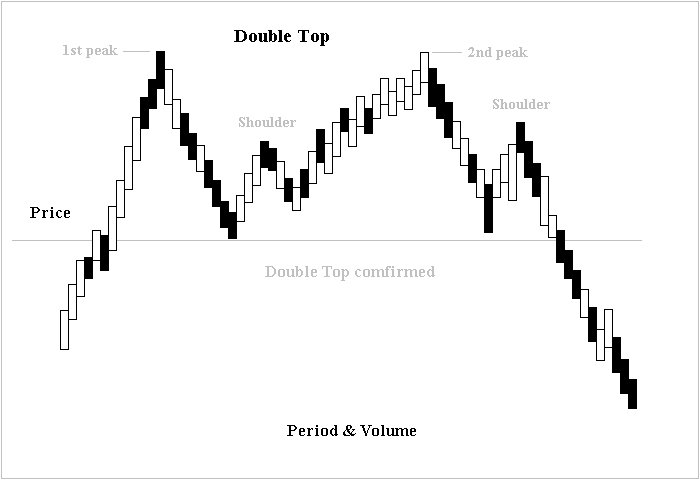
Double Tops (M Tops) and Double Bottoms (W Bottoms) — Signs of Market Hesitation
Double Top (M Top) refers to what is also known as “double top.” It appears like an "M" shape on a chart at high prices.
The first peak leads to a pullback; upon the second rebound near similar heights, it declines again and eventually breaks below the intermediate low. This demonstrates the heavy selling pressure above, making upward momentum hard to sustain.
For example:
GBP/USD encountered resistance around 1.35 twice; after breaking below the neckline of 1.30 during its second descent, it eventually dropped all the way to 1.25.
(Source: Wikipedia)
The double bottom also known as “W Bottom,” appears in declining trends as a reversal pattern indicating potential upward movement when breaking through its neckline—forming a bullish signal.
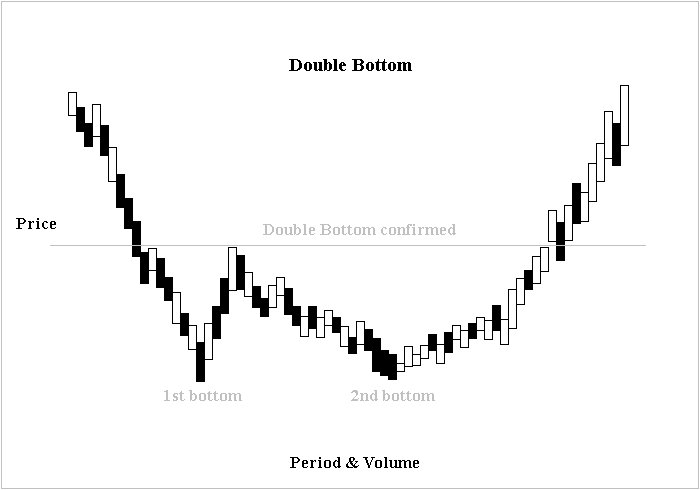
(Source: Wikipedia)
- Continuation Patterns
Continuation patterns indicate that the market will resume its original trend after a brief consolidation period. Typical continuation patterns include triangles, flags, and wedges.
Triangle Patterns
In triangle patterns, the price fluctuations gradually narrow, with highs and lows converging as buyers and sellers reach a stalemate.
Symmetrical Triangle: The slopes of the upper and lower trend lines are nearly equal. A breakout from this formation usually extends in the same direction as the prevailing trend.
Ascending Triangle: The lower trend line slopes upward while the upper trend line remains horizontal, indicating that bulls are gathering strength to break through resistance.
Descending Triangle: The upper trend line slopes downward while the lower trend line is horizontal, suggesting that bears are suppressing any bullish attempts.
Regardless of the type of triangle, when the price breaks out of its boundary (either upward through the upper trend line or downward through the lower trend line), it’s akin to determining a winner in a tug-of-war—the prevailing trend will continue to extend.
Flag Patterns
Flag patterns appear after a sharp rise or fall in price, resembling a flag on a flagpole.
Bullish Flag: After a rapid price increase, it enters an "upward-sloping channel" (the upper trend line slopes downward while the lower trend line slopes upward).
This provides bulls with a pause for breath; breaking above the upper boundary often leads to continued upward movement.
Bearish Flag: After a rapid decline in price, it enters a "downward-sloping channel." A breakout below the lower boundary typically signals further downward movement.
Wedge Patterns
In wedge patterns, both trend lines tilt in the same direction but at different angles, forming a narrow "tunnel."
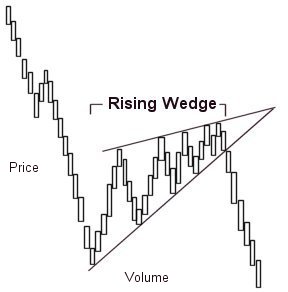
Rising Wedge: Although both lines slope upward, the upper line is flatter while the lower line is steeper.
This may indicate diminishing bullish momentum and often acts as a bearish signal.
Falling Wedge: Both lines slope downward; however, here, the lower line is flatter, and the upper line is steeper.
This indicates diminishing bearish pressure and generally serves as a bullish signal.
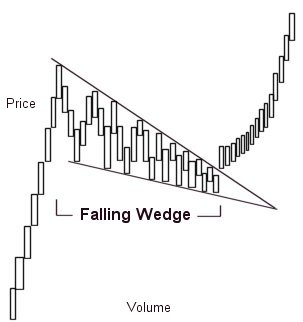
(Source: Wikipedia)
What Are Technical Indicators?
- Trend Indicators
Moving Averages (MA)
You can think of moving averages as tools that "smooth out" price fluctuations.
They utilize average values over various periods (such as 10 days, 50 days, or 200 days) to indicate whether the market is heating up (bullish) or cooling down (bearish).
Short-term Moving Average (e.g., 10-day MA): Responds quickly and is well-suited for capturing short-term fluctuations.
Long-term Moving Average (e.g., 200-day MA): More stable, indicating long-term trends.
When the short-term moving average crosses above the long-term moving average (a golden cross), such as a 10-day MA crossing above a 50-day MA, it’s like a green light turning on—it may signal a buying opportunity.
Conversely, when the short-term moving average crosses below the long-term moving average (a death cross), it resembles a red light—indicating that it might be time to exit.
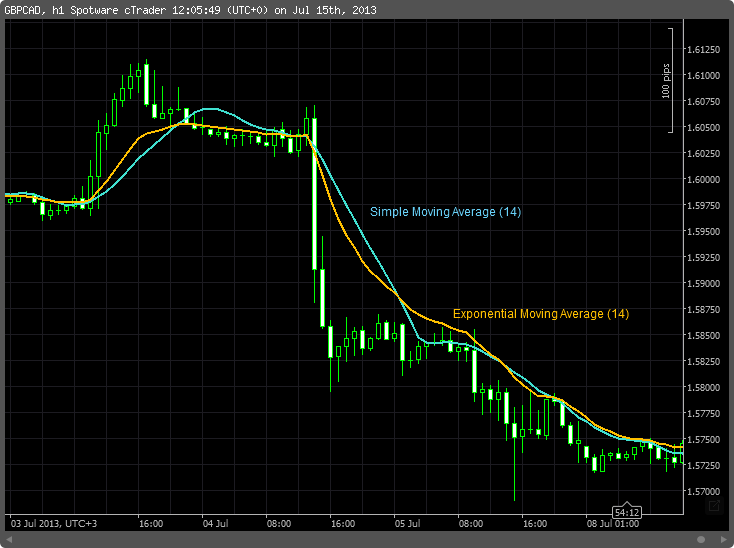
(Source: Wikipedia)
MACD
The MACD serves as an "electrocardiogram" for market trends. It consists of two lines and a histogram that helps gauge the strength and changes in trends.
When the fast line (MACD line) crosses above the slow line (signal line) and the histogram shifts from green to red, it indicates increasing bullish momentum—this might be your entry point.
Conversely, when the fast line crosses below the slow line and the histogram changes from red to green, bearish control is evident—signaling potential downside risks.
The height of the histogram also reflects the "heartbeat" of trends—an increase in length suggests strengthening trends, while a decrease may indicate potential reversals; hence you should pay extra attention during those times.
.gif)
(Source: Wikipedia)
- Oscillator Indicators
Relative Strength Index (RSI)
The RSI can inform you if the market has been running too fast and needs to cool off.
Values surpassing 70: This resembles someone gasping for breath after running 10 kilometers; it signals that the market is overbought and could experience a pullback.
For instance, if you observe EUR/USD continuously rising with an RSI of 75, caution about possible declines is warranted.
Values below 30: This likens to someone so exhausted they can't move anymore; it indicates oversold conditions with potential rebounds ahead.
For example, after GBP/USD plummets with an RSI reading of 25, you should look for possible rebound opportunities.
However, remember that in strong trends, RSI may remain at elevated levels for extended periods—avoid rushing into contrarian positions based solely on this indicator; it's essential to corroborate your findings with additional signals.
(Source: Wikipedia)
Stochastic Oscillator
This indicator conveys which side has dominance through crossings between %K and %D lines—vital for determining entry points.
When %K crosses above %D from below while both are under 20 (golden cross): This signifies an underdog team suddenly gaining momentum—indicating potential rebounds suitable for buying.
When %K crosses below %D from above while both are above 80 (death cross): This suggests potential pullbacks may occur—providing cues for selling opportunities.
However, note that oscillators can easily fail during trending markets; even in strong uptrends, signals indicating overbought conditions might merely signify a temporary pause rather than a reversal—you must consider trend indicators alongside them.
How to Optimize Trading Strategies by Integrating Chart Patterns and Indicators?
Combining Patterns + Indicators: A More Reliable Signal
Looking at patterns or indicators independently can be misleading; for instance, focusing solely on a double top pattern might lead to encountering a "false breakdown," while relying only on an overbought RSI might cause you to miss a genuine trend.
However, combining both can help fill in the gaps.
Case Study: Double Top + RSI Divergence
When the price forms an “M” shape (double top), and you notice that the RSI at the second peak is lower than at the first peak (divergence), it’s like having both an "alarm" and a "red light" flashing simultaneously—this significantly increases the credibility of your bearish signal.
For example, if you observe a double top pattern around 0.74 for AUD/USD while the RSI drops from 70 to 65, followed by a breakdown below the neckline, leading to a drop-down to 0.70, you'll have greater confidence in taking a short position.
Operational Mantra: Patterns dictate direction, and indicators determine timing—use patterns to assess whether a trend is reversing and indicators to confirm if entry points are appropriate.
What Are the Limitations of Technical Analysis?
While technical analysis is widely used in forex trading within financial markets, it is not without its limitations.
Lagging Nature
Technical indicators often rely on past data, which leads to a certain level of lagging response.
Fundamental Blind Spot
Over-reliance on technical indicators while neglecting fundamental analysis can lead to misjudgments. For example, no matter how low the RSI may be, if war suddenly breaks out or central banks raise interest rates, all pattern signals could be quickly invalidated.
Emotional Disturbance
During market panic, indicators may frequently issue false signals; for instance, an oversold bounce during a sharp decline might merely represent "a last gasp." Therefore, validating signal reasoning with fundamental aspects becomes essential.