


- MACD tracks trend momentum shifts.
- RSI spots overbought and oversold extremes.
- Together, MACD + RSI give stronger signals.
- Best used with risk management discipline.
Why Technical Analysis Still Matters
TradingKey - In news-, data-, and sentiment-driven markets, timing matters. Long-term investors think fundamentally, but traders and active investors utilize technical analysis of entry and exit points. Out of hundreds of such indicators, there are only two that have emerged as simple and successful: the Moving Average Convergence Divergence (MACD) and the Relative Strength Index (RSI).
Both indicators are not foolproof, but together they provide valuable information on momentum, trend reversals, and changes. MACD and RSI are highly useful for traders who work with volatile markets, stock, cryptocurrency, or forex.
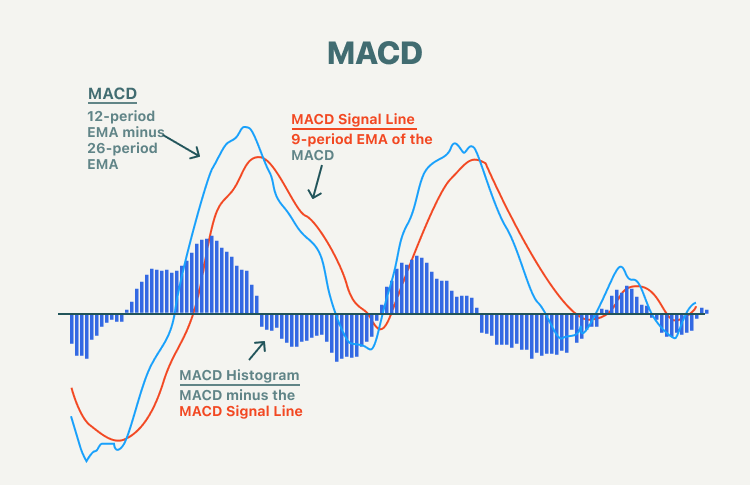
Understanding MACD: Tracking Momentum
The Moving Average Convergence Divergence, or MACD, is generated to quantitatively assess momentum and recognize shifts in direction of the trend. The MACD contrasts two exponential moving averages (EMAs), which tend to be the 12-day and 26-day, and indicates the difference as the MACD line. A signal line, usually a 9-day EMA of the MACD line, is overlaid as well.
When the MACD line passes above the signal line, you receive a bullish indication, which indicates momentum picking up on the upside. When the MACD passes below the signal line, you receive a bearish indication, which means momentum is picking up on the downside.
Traders also seek “centerline crossovers.” When the MACD moves above zero, it suggests bullish conditions; a move below zero signals bearish conditions. These signals, used in combination with chart patterns or support and resistance levels, aid in confirmation of entry or exit points.
The MACD histogram, bars showing the distance between the MACD and the signal line, is a bonus dimension. Wider bars mean gaining momentum, and contracting bars mean losing momentum. You'll perceive potential trend reversals earlier by seeing with the histogram.
Source: https://www.sahmcapital.com
Comprehending RSI: Identifying Overbought and Oversold
Relative Strength Index, or RSI, measures the speed and amount of price movement. The index is scaled 0 to 100 and is applied most often for overbought or oversold conclusions.
A level of 70 or above means an asset is overbought and ripe for a correction. A level of 30 or less means it's oversold and ripe for a reversal. Traders see these numbers as contrary signals: sell on overheating, buy on overselling.
Yet, hard and fast rules like those above do not apply to subtle indicators like RSI. A strong upward trend may keep RSI significantly above 70 without reversing. Similarly, on downtrends, RSI may remain below 30 for longer than expected. Hence, such subtle indicators like RSI should be used with other indicators like MACD to confirm signals.
Another of RSI's strengths is divergence. When the price establishes a new high but the RSI fails to validate with a new high, it suggests deteriorating momentum, a bearish divergence. When the price establishes a new low but the RSI fails to, it suggests a potential bullish reversal. The divergences tend to predate significant trend reversals.
-eee68e70fb634362b7450d9065d25ed9.jpg)
Source: https://www.alchemymarkets.com
Using MACD and RSI for Timings
Separately, MACD and RSI generate erroneous signals. Together, they form the more powerful system. As a case in point, if MACD gives a bullish crossover and the RSI suggests the asset is no longer overbought, they support each other. If MACD gives bearish momentum and the RSI suggests overbought conditions, it makes more of a case for exiting.
Assume you have a strongly rising stock. MACD may confirm rising momentum on a bullish crossover but if RSI moves above 80, it means the current spike is overbought. The trader can still ride the trend but use tighter stop losses or get out of the position. Similarly, if both indicators reflect bullish signals at the same time, i.e., MACD crossovers on the positive side as RSI reverses from lows of oversold conditions, it can provide high-probability entry points.
The multi-level system reduces reliance on any specific instrument. Traders can also incorporate context in volume analysis, moving averages, or support and resistance levels. The goal isn't necessarily prediction but odds of entering and exiting at the best times.
-18c24ea03aef499da5a402994c0522f0.jpg)
Source: https://www.webull.com
Practical Applications Across Markets
MACD and RSI function on almost any market. On stocks, they facilitate timing entry points for news events or announcements. On cryptocurrencies, wherein volatility is significant, they introduce order to hitherto random price movements. On forex, they aid in quantifying momentum shifts in currency pairs often catalyzed by macroeconomic announcements.
Swing traders use these indicators to find multi-day to multi-week set-ups. As an example, seeing a bullish MACD crossover after a prolonged downtrend, in combination with RSI moving up from oversold, is indicative of the start of a recovery rally. Day traders may use shorter horizon, using 5-minute or 15-minute charts, to play intraday movements.
Long-term investors also benefit. Those who hold for years use MACD and RSI to decide if they should buy more, rebalance, or hedge. While not perfect, they do give a timing aspect that fundamentals do not.
Limitations and Risks
As with all technical indicators, MACD and RSI have a slight delay. They respond to price action after it's happened, so signals often arrive late on fast-moving markets. False signals occur often, especially on noisy, lateral markets with questionable trends.
Overreliance is another danger. Traders who depend on indicators without considering broader context, news, fundamentals, or macro trends, welcome surprises. Not a means but merely a way of managing and not eliminating risk.
Risk management is therefore paramount. Even in the case of MACD and RSI concurring, trades must be well-sized, with stop-losses and definite exit plans. The indicators increase probabilities but do not provide certainty of outcomes.
Conclusion
MACD and RSI remain two of the most popular technical indicators for a reason. They define momentum and strength in concise, actionable signals. When used together, they allow traders and investors to sift noise, recognize reversals, and time entry and exit points with more conviction.
However, its true power lies not in foretelling the future, but in staying disciplined. By trading systematically, instead of making rash decisions due to fear or greed, traders do not. Applied for day trading, swing trading, or as a supplement to longer-term methodologies, MACD and RSI give a system for trading volatile markets. Eventually, successful investing is not a question of optimal timing, but repeatable decision-making. MACD and RSI will not work on every trade, but they will allow you to play the odds with conviction and framework, and that’s the best approximation of an edge in markets that will always remain uncertain.
