


Oracle Stock Price Forecast: $20 Billion Financing Plan Sends Stock Down Nearly 9%, ORCL Shares May Retreat Toward $100 Mark



AI Podcast


As of November 2 Eastern Time, Oracle stock fell 8.76% to $119.22, extending a three-day pullback to 17.5%. The decline was driven by a newly announced $20 billion debt and equity financing plan to fund AI and cloud infrastructure expansion, raising short-term equity dilution and capital expenditure concerns. Despite long-term revenue projections exceeding $225 billion by FY2030, free cash flow will remain negative until late FY2028. Technically, the stock remains in a bearish trend below the 60-day moving average with negative MACD, eyeing critical support at $115, a breach of which could trigger further downside toward $100.

TradingKey - As of the close on Monday (November 2) Eastern Time, Oracle (ORCL) stock fell sharply by 8.76% to close at $119.22, hitting an intraday low of $118.43, with volume rising to approximately 58.16 million shares. Since touching an intraday high of $148.48 on October 28, ORCL has fallen for three consecutive trading days, with a cumulative pullback of about 17.5%.
Why Is Oracle Stock Falling?
Oracle recently disclosed that it plans to raise approximately $20 billion in total through debt and equity financing, including roughly $10 billion in debt financing and roughly $10 billion in equity financing. The proceeds will primarily be used to support the company's expanding AI and cloud infrastructure investments, as well as for debt repayment, capital expenditures, and other general corporate purposes. Oracle's stock fell 8.76% on Monday following the announcement.
The debt financing portion is planned to be divided into six bond tranches with different maturities ranging from 2029 to 2046. On the equity side, the offering price is set at approximately $116 per share, representing a discount of about 11% to the previous trading day's closing price. For existing shareholders, the new share issuance increases the total share count, requiring the market in the short term to re-evaluate the potential impact of equity dilution.
This financing is not Oracle's first large-scale entry into the capital markets this year. Earlier this year, the company announced a 2026 financing plan aiming to raise $45 billion to $50 billion through debt and equity financing to expand Oracle Cloud Infrastructure (OCI) capacity to meet cloud computing demand from customers such as OpenAI, Meta (META), Nvidia (NVDA), AMD (AMD), and xAI. The company had also previously completed a $20 billion ATM stock offering.
At its October 28 Investor Day, Oracle stated that it expects total revenue to exceed $225 billion in FY2030, with a compound annual revenue growth rate of over 35% from FY2026 to FY2030. Meanwhile, the company expects capital expenditures to remain at peak levels in FY2027 and FY2028, with free cash flow not expected to turn positive until the second half of FY2028 and projected to exceed $30 billion in FY2029.
The company also committed that from now through FY2030, additional capital market financing—excluding existing debt refinancing—will be capped at around $20 billion, with $10 billion expected from equity and $10 billion from new debt. From this perspective, the latest financing is largely consistent with its previously announced long-term capital plan and does not indicate a sudden, sharp increase in fundraising scale.
However, market reaction indicates that while Oracle's free cash flow has yet to turn positive, investors are particularly sensitive to financing needs driven by AI infrastructure expansion. Compared with major cloud service providers such as Microsoft and Amazon, Oracle has a smaller overall revenue scale while needing to invest heavily in data center construction and AI computing equipment. Consequently, borrowing costs, debt levels, and the payback period on capital expenditures have a relatively more direct impact on its valuation.
Oracle Stock Price Technical Analysis
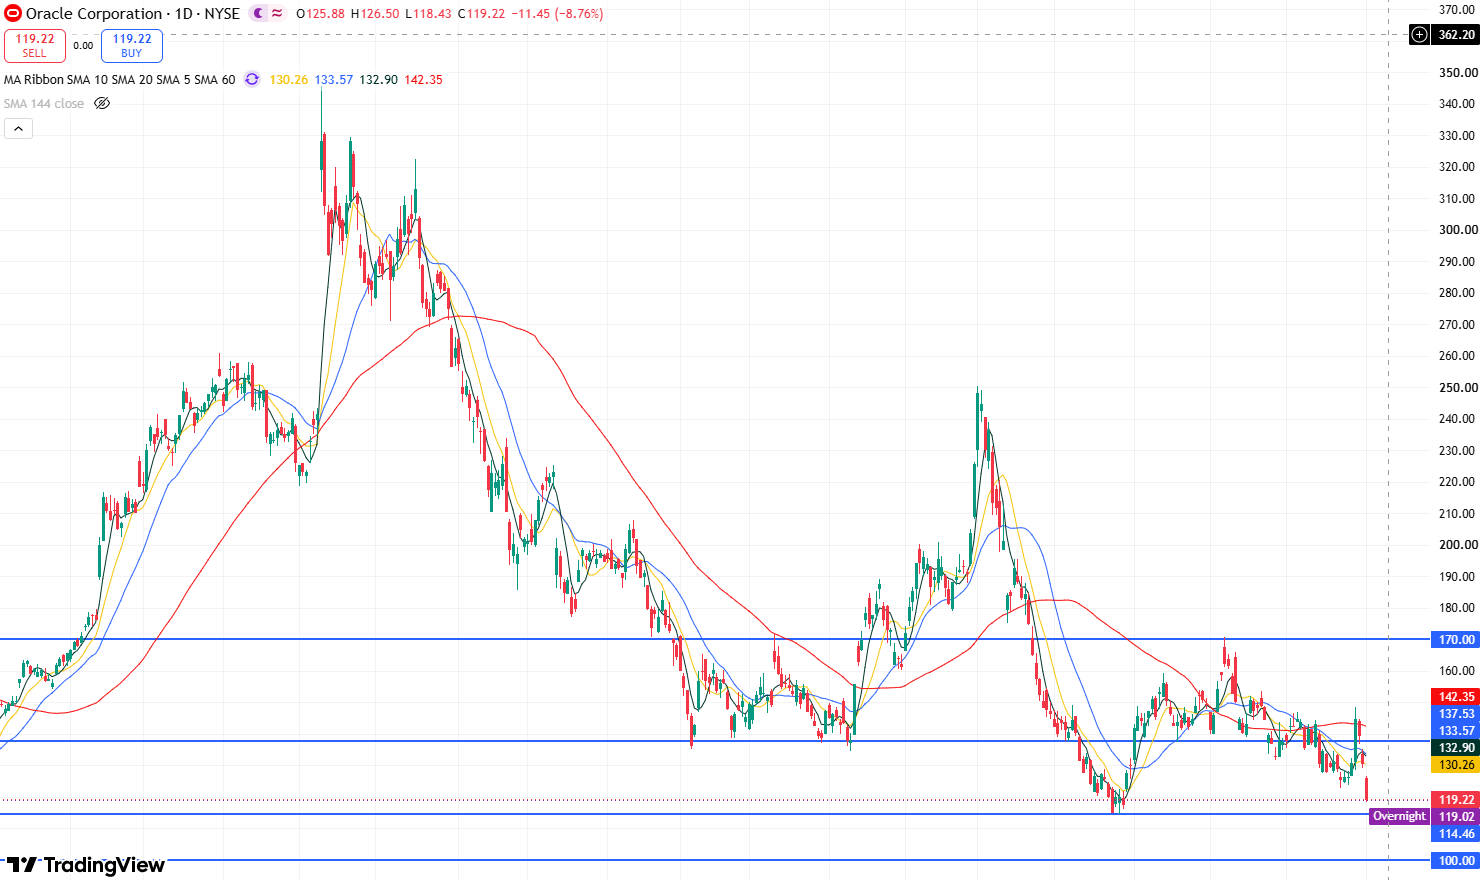
Oracle stock price daily chart, Source: TradingView
Looking at Oracle's daily stock price chart, the overall candlestick pattern exhibits a clear structure of lower highs and lower lows, indicating that the stock's medium-to-long-term trend remains bearish. Meanwhile, although recent price action surged 10.73% on October 28, briefly boosting market sentiment, it remains under pressure below the 60-day moving average. Having fallen for three consecutive trading days and broken below the October low of $122.76, further downside room has opened up for the stock.
In terms of technical indicators, the Relative Strength Index (RSI) stands around 38.4, having not yet entered oversold territory, while the MACD remains negative, suggesting that the stock still has room for further decline.
At present, the primary support level to watch below is $115. If this level fails to hold, the stock may retreat deeper toward the $100 mark. Conversely, if the price holds firmly above $115, a short-term technical rebound could emerge, with the primary target testing the resistance level near $125. Further above lies the area around $148; only if the stock breaks through and holds above $148 can it be expected to test the resistance at $170.
This content was translated using AI and reviewed for clarity. It is for informational purposes only.
Recommended Articles










Comments (0)
Click the $ button, enter the symbol, and select to link a stock, ETF, or other ticker.