

Top 5 High-Conviction Setups: NVIDIA’s $1T Vision, RKLB’s Moonshot, and the Mispriced Swarmer IPO Mania


AI Podcast
The market in late March 2026 exhibits significant divergence, with AI leaders like NVIDIA and Alphabet building strong moats, while speculative tech and space infrastructure stocks face volatility. NVIDIA's $1 trillion revenue forecast hinges on its new Rubin architecture challenging Google's TPUs. Swarmer, Inc. (SWMR) saw a 520% IPO surge, indicating investor enthusiasm for drone software infrastructure despite a lack of profitability. The Trade Desk (TTD) faces headwinds from an audit and analyst downgrades, but its core business and CEO's confidence provide support. Rocket Lab (RKLB) gains momentum with defense wins and Neutron rocket progress. Alphabet (GOOGL) is scaling AI infrastructure, with strong cloud performance and share buybacks bolstering its stock. Execution and transparency are key as the market navigates these varied trends.
TradingKey - The market at the end of March 2026 has hit a wall and the dream of a "tide that lifts all boats" has turned into a nightmare. Suddenly everyone's seeing a violent divergence: there are the AI Landlords (NVIDIA, Alphabet) who are quietly building massive $100B+ moats, while Space Infrastructure (Rocket Lab) (RKLB) and Speculative Tech (Swarmer) are sending retail investors scurrying in a panic to get in on the action.
Knowing which game is being played is crucial if you're going to spot a breakout before getting stuck in a liquidity trap: a nasty place to be. To help you navigate, here are the key stock patterns to watch this week.
Ticker | Spotlight | Key Levels |
NVDA | GTC 2026 & $1T Revenue Forecast | Resistance: $163 |
SWMR | 520% IPO Surge (Drone Software) | Resistance: $31.00 |
Ad-Tech Headwinds & Publicis Audit | Resistance: $26.73 | |
RKLB | $816M Defense Win & Neutron Progress | Resistance: $84.96 |
$185B AI CapEx & Cloud Dominance | Resistance: $318.80 |
1. NVIDIA (NVDA) Stock Analysis 2026: GTC Keynote and $1T Revenue Outlook
NVIDIA (NVDA), at the moment, in some high stakes consolidation limbo. NVDA shares are trading near $182 after a pretty modest 0.7% dip on March 17. And yet here's this massive company boasting a $4.45 trillion market cap, but the price action is a classic case of buying the rumour and selling the news after the GTC 2026 conference. The fact that the long term momentum remains historically strong is little comfort for short-term traders who are stuck in a 52-week range that has seen the stock do a crazy dance from $86 up to highs of $212.
GTC 2026: The $1 Trillion Roadmap
On the fundamental front, CEO Jensen Huang boldly predicts that NVIDIA will hit a whopping $1 trillion in cumulative revenue by 2027 - a figure that's more than ambitious even by NVIDIA's lofty standards. The driving force behind this prediction is a shift towards practical, agentic AI and the emergence of 'AI factories' - a transformation that has basically flipped NVIDIA from being a chipmaker to a full-fledged infrastructure powerhouse.
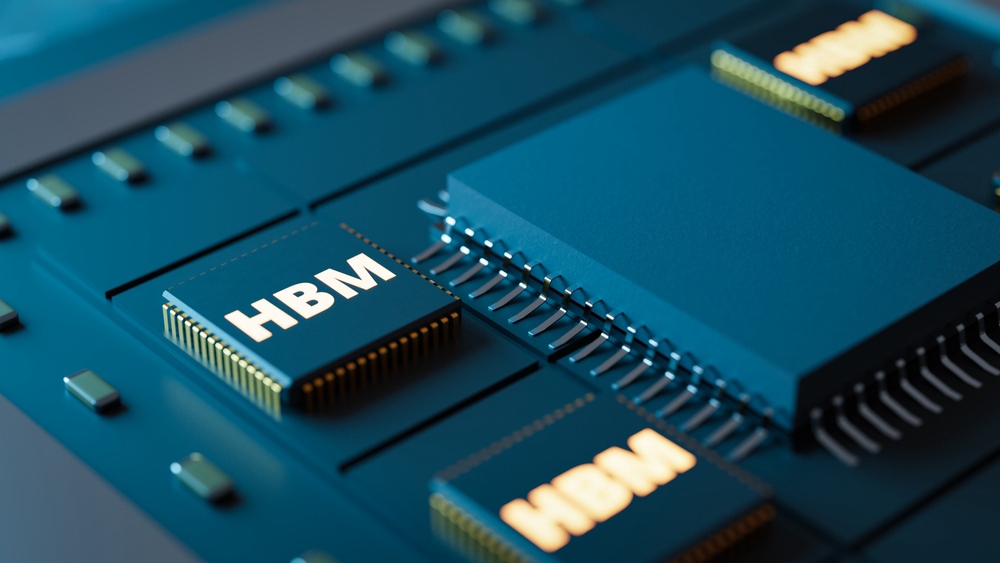
The Rubin architecture is a whole lot more than just a minor tweak; it signals a complete about-face in agentic AI. By slapping in that proprietary Vera CPU alongside some seriously fast HBM4 memory, NVIDIA is claiming a 5x performance boost when it comes to inference.
This is a direct riposte to the growing threat of Google's Ironwood TPU, which has been gaining momentum in the hyperscale world because of its ability to knock it out of the park on the efficiency front per pod.
While Ironwood lets Google scale all the way up to 9,216 chips at once in one huge unified pod - and that's got to make internal workloads a lot cheaper in the end - NVIDIA's Rubin is aiming to keep its grip on the market by delivering far better "chip for chip" flexibility plus a top-notch software ecosystem that Google's locked-down hardware just can't keep up with yet.
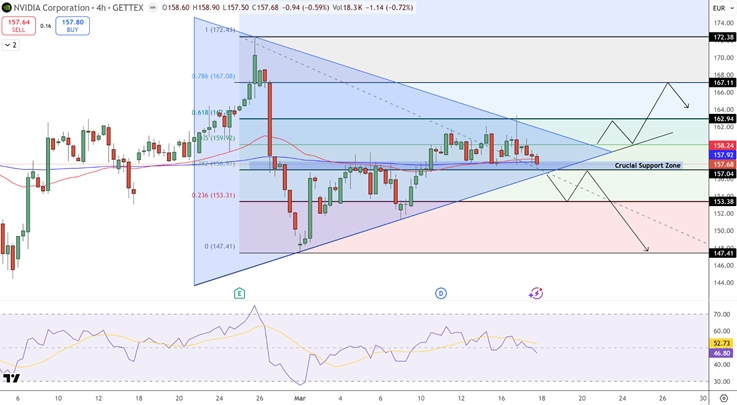
NVIDIA (NVDA) Price Chart - Source: Tradingview
At the end of the day, NVDA is wound up like a tightly coiled spring. On the 4-hour chart the price is stuck in a symmetrical triangle near the €157.70 (GETTEX) mark - and this is exactly what it looks like when bulls and bears are locked in a standoff with the RSI sitting right in the middle at 50. The stock is currently testing a pretty crucial support zone between €157.00 and €158.20 - that's also where the 200-period moving average is sitting.
If NVDA can close above €163 that will be the bull's call - and the €172 supply zone could be the place to be. On the other hand, if the price slips below €157 that could see a slide all the way back down to the €147 support level. What happens next will come down to which side of the triangle gives way first.
2. Swarmer, Inc. (SWMR) Stock Analysis: Inside the Most Mispriced IPO of 2026
Swarmer, Inc. (SWMR) has burst a historic Nasdaq debut, shooting up a whopping 520% to close its first session at $31.00. Following its IPO at a $5.00 per share value, the stocks of SWMR became an overnight sensation. All thanks to an IPO that specialists at Exec Edge Research are saying is a prime example of a spectacularly underpriced listing and possibly one of the most mispriced ones in recent memory.
With a market cap now hovering around the $383 million mark and trading a whopping 9.07 million shares on its maiden day, Swarmer has kicked off a whole new wave of investor mania within the drone-software infrastructure space.
Effective March 17, 2026, Swarmer is currently in the thick of a price discovery phase, a state of total uncertainty that is in many ways a fresh start for the company. The likes of P/E ratios and EPS are completely irrelevant at the moment since the company is not yet profitable. But that’s exactly what it’s all about here, a story of autonomous drone-software infrastructure.
The 24 hours of trading that saw the 52 week range go from $11.25 to $40.00 is just a tiny blip in the grand scheme of things, and with no historical revenue to speak of, the valuation of Swarmer is really all about future growth, just how much the average retail investor believes in it.
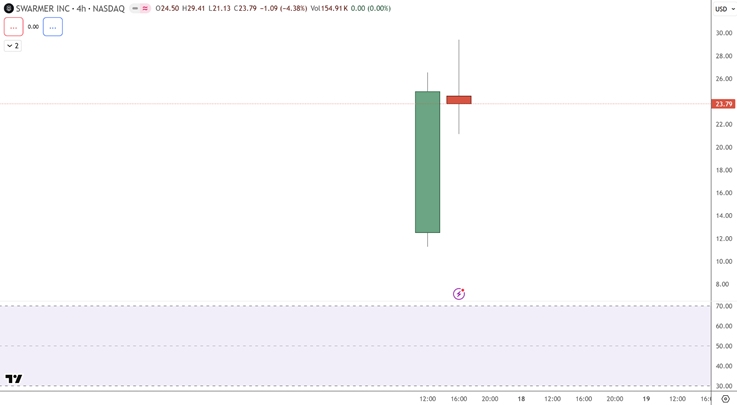
Swarmer Inc Price Chart - Source: Tradingview
On a technical front, the SWMR is like the definition of an order flow imbalance. The stock took a wild swing in the after-hours following its IPO, hitting a peak of $44.70, but has now levelled out into a pretty volatile mess on the 4 hour chart. Right now, the first line of defence is the roof at $29.40 and the much more psychologically significant $31 mark. To get back to testing the zone where the stock rocketed up to $40-$45, we'd need to see a sustained break above $31.
The stock found a bit of a temporary respite around $23.79 but the real safety net is $21.13. If the stock falls below $21 it'll be like throwing a falling knife into a void - there's just no support to catch it. Considering the complete lack of history to go on, standard indicators like moving averages aren't worth much at the moment. So let’s expect the market to keep on swinging and trying to figure out what this thing is really worth.
3. The Trade Desk (TTD) Stock Analysis: Navigating Ad-Tech Headwinds and $25 Support
The Trade Desk (TTD), at the moment, is exhibiting a bearish bias, with shares price plunging nearly 7.42% to close at around $25.07. The recent dip in price has sent share value toward the lower end of its volatile 52-week trading range of $21.08–$91.45. Overall, it’s leaving the market cap at approx $11.93 billion.Whereas, the company is maintaining a solid balance sheet and a trailing P/E of 27.86. Hence, the short term sentiment has improved significantly as the platform is facing audit concerns and analyst downgrades.
The main reason for the recent stock sell-off is this high-profile audit by Publicis Groupe that's uncovered some significant billing concerns & discrepancies with their fees. All this has somehow really put a cloud over the much anticipated launch of the Kokai platform - the next big thing in ad-tech from The Trade Desk that everyone's been waiting on. The audit has already prompted some analysts, like the ones at Wedbush, to start questioning whether it's time to downgrade their rating on the stock to an 'Underperform' - as the market tries to balance out the potential damage to the company's reputation versus the fact that they've still got a sound engine for growth in areas like Connected TV and video ad space.
Despite all the noise going on, though, the underlying numbers are still looking pretty good. Over the last 12 months, for example, The Trade Desk has raked in $2.9 billion in revenue and a pretty solid $443 million in profit. And what really puts the icing on the cake is that CEO Jeff Green is sending a pretty clear signal to the market here that he's actually confident in the company by personally buying up more shares as the price dips.
That, combined with all the whispers in the industry suggesting that they might be pairing up with OpenAI down the line, makes it look like the argument that TTD is well on its way to being a major player in the future of the open internet is still pretty solid even if the audit is making all the headlines right now.
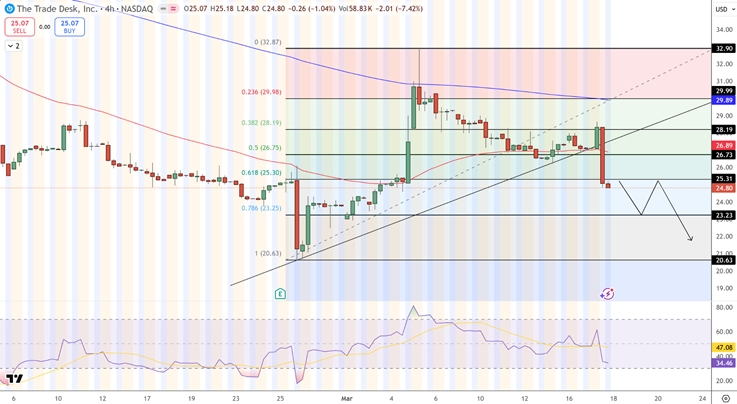
Trade Desk (TTD) Price Chart - Source: Tradingview
Taking a look at the 4-hourly timeframe, TTD is starting to form a lower high. It suggests that the stock price is moving into a bit of a pullback phase. On the 4 hour chart, the price dropped not just below the key $25.31 support but also below its 50-period moving average at $26.89.
The RSI has dropped into the mid-30s which tells us that the sellers are starting to get more active. It looks like they aren't slowing down. Since the 0.618 Fibonacci retraced a touch and failed to hold, the next support level is down at $23.23.
Alternatively, if the price fell below $23.23, it might just test the major swing low at $20.63. The bulls need to push TTD back up above $26.73 to regain the upper hand. Until that happens, the technical outlook for the stock looks pretty bearish.
4. Rocket Lab (RKLB) Stock Analysis: Neutron Milestones and $816M Defense Win
Rocket Lab(RKLB) shares sprang 10.21% to $78.59 on closing March 17 - a strong jump following a pretty major operational breakthrough. This uptick comes after a wild year for the company's stock price which has seesawed back and forth between $14.71 and $99.58. Trading volume hit an impressive 27 million shares, showing that investors are pretty clearly responding to the progress Rocket Lab's making in its bid to give SpaceX a run for its money.
The real moonshot for investors though is the Neutron rocket - a game-changer that's proving Rocket Lab can seriously challenge SpaceX's grip on the market. By making rapid progress with the 'Hungry Hippo' fairing and thrust structures, Rocket Lab is demonstrating its ability to deliver on a medium-lift vehicle that puts some serious pressure on Musk's SpaceX.
Unlike all those other 'New Space' start-ups that rely on outsourcing to third-party suppliers, Rocket Lab has the edge of a vertically integrated model - that's to say, they do their own launch services and satellite manufacturing in-house. That's why the top analysts over at Cantor Fitzgerald and Needham are calling out the $95 price target as being justified by Rocket Lab's unique setup.
In this launch industry where execution is the bottom line, Rocket Lab stands out from the crowd as one of the only players actually getting its launch manifest on track.
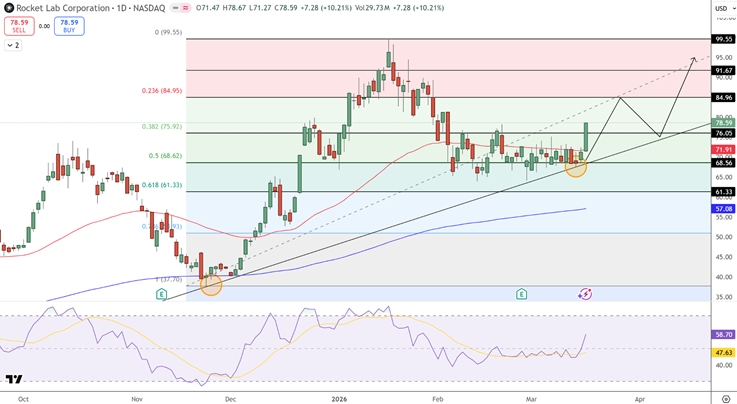
Rocket Lab (RKLB) Price Chart - Source: Tradingview
From a purely technical standpoint, RKLB has just come off the back of its long term support structure. On the daily chart, you can see the stock bounce off a pretty clear upward trending line near $68.50, which just so happens to line up perfectly with the 0.50 fibonacci retracement and also where the 50 day moving average is sitting.
The RSI is edging its way towards 58, which suggests to me that the slight price pause we've had recently has actually been a cue to bring in some new buyers rather than any kind of signal to reverse trend.
The next key level to watch out for is $84.96. If the stock manages to close above that price then it could easily push on up to $91.67, and who knows, possibly even go on to test that important $100 mark again. As long as the stock stays solidly above that $68.50 - $71.90 support zone then it's more likely to keep pushing on upwards.
5. Alphabet Inc. (GOOGL / GOOG) Stock Analysis: AI Infrastructure Scaling and $300 Support Defense
Alphabet Inc. (Google) is holding onto its lead in the AI space, with its shares remaining steady at around $310 after a modest 1.75% bounce. It may be a fair bit off its February high of $349 but the company's market cap is still a whacking $4 trillion. Investors are trying to balance the promise of really strong 2025 earnings, with revenue at a record-high $400 billion for the first time, against a pretty hefty $175-$185 billion capital expenditure plan the company has for next year. This scale of investment is a clear sign of Alphabet's commitment to getting Gemini and its global AI infrastructure up and running properly.
We're already starting to see some serious returns from that investment in the Cloud division, which has just posted a healthy $17.7 billion in quarterly revenue - a 48% year on year jump.
This is no longer just about chucking cash at research and development, it's now more about turning a tidy profit - high margin profit that is. And another thing that's shifted in Alphabet's favour is the fear that AI would one day cannibalize its Search business. Actually the opposite is true - the more Alphabet gets into AI, the more Search users are actually using. The company also recently struck up a deal with Apple to power its mobile ecosystem with Gemini - and that's a major coup in the mobile web.
Of course all this comes with a side of regulatory scrutiny - Alphabet is under fire from the DOJ and EU - but investors are more interested in the $70 billion buy back plan and the brand new dividend that Alphabet has just spun up. These two are providing a solid floor for the stock and giving investors some solid reasons to stick with Alphabet.
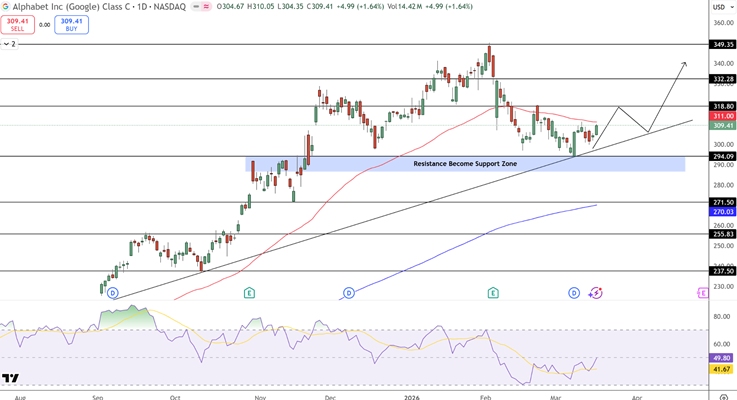
Alphabet Inc Price Chart - Source: Tradingview
On the technical front, after pulling right back from its dizzying $349 peak, the stock's seen some serious buying interest at an important price point. That $294.09 level, which had been such a major speed bump for the stock back in late 2025? Now we all remember how hard that level was for the stock back in late 2025; to see buying interest rallying at that point now makes total sense, especially with the big long-term trend line heading upwards and the psychological lift of hitting that all important $300 mark.
Right now we're seeing the stock price put to the test against the 50-day moving average - and that's at around $311. A close above that level and we'd be looking at a pretty clear indication that the correction's over.
First things first though, if it manages to push past $318.80, then the next target would be $332.28. If buyers can keep the momentum going and push the price above $318, you can expect they'll be eyeing up that $349 all-time high again. But, if support at $294 does turn out to be flaky, then we're looking at the 200-day moving average around $271 as the next place to test the waters.
Conclusion
As March 2026 keeps rolling on, the reality is finally sinking in: talking the talk is no longer enough, execution is what really counts. Big players like, NVIDIA and Alphabet, are throwing massive amounts of money at AI. But, the market now wants more transparency and stronger foundations. This has been proven in the recent pullbacks for The Trade Desk. Stocks like Swarmer and Rocket Lab are still pretty much in limbo and their prices are all over the place.
Investors should definitely keep an eye on those 'support flips' we were talking about in the technical sections - where the market really makes a turn will probably be determined by those specific points.
Recommended Articles


Comments (0)
Click the $ button, enter the symbol, and select to link a stock, ETF, or other ticker.