U.S. Stock Market Risk Assessment: Learning from History, Mid-Term Outlook Remains Secure

Executive Summary
This article will use economic principles as a starting point, combined with historical lessons, to thoroughly analyse whether the U.S. stock market currently faces the risk of a significant correction. From a theoretical perspective, before every major stock market correction or crash, a series of warning signals typically emerge: first, high inflation prompts sustained interest rate hikes by the Federal Reserve; second, economic growth enters a recession; and third, the yield curve inverts. Additionally, high valuations and excessive leverage often signal a frothy, bubble-like market. If we liken high valuations and leverage to dry tinder, the Federal Reserve’s rate hikes act as the spark. Only when Tinder and Spark interact does the market ignite into a full-blown collapse. Therefore, we argue that the Federal Reserve’s monetary policy is the most critical factor influencing the stock market.
Looking back at history, speculative fervour reached a fever pitch in the U.S. during the late 1920s, the so-called "Roaring Twenties." As the Federal Reserve initiated interest rate hikes, the U.S. stock market suffered a catastrophic collapse in October 1929. Similarly, during the "Black Monday" crash of 1987, a wave of automated sell orders triggered by computerised stop-loss mechanisms, combined with the Fed’s rate hikes to curb inflation, precipitated a sudden market plunge. In the 2000 dot-com bubble, internet-related stocks soared on the narrative of a "new economy," pushing the Nasdaq’s price-to-earnings ratio to an extraordinary 100. However, the Fed’s sustained rate hikes starting in 1999 drained market liquidity, acting as the catalyst that burst the bubble, leading to a 77% plunge in the Nasdaq and the collapse of many internet companies. The 2008 global financial crisis was triggered by irrational exuberance in the U.S. housing market and the proliferation of subprime mortgages. Wall Street’s financial innovations packaged these toxic loans into securities sold globally. The Fed’s rate hikes sparked a housing market downturn, which unravelled the financial system, with Lehman Brothers’ bankruptcy amplifying the crisis into a global financial tsunami. History shows that while Federal Reserve rate hikes do not always cause market crashes, every major crash has been closely tied to the Fed’s sustained tightening of monetary policy.
Looking at the current situation, July’s CPI data aligned with expectations. Milder-than-expected tariffs, rising rental vacancy rates, and a weakening labour market together support an optimistic outlook for inflation. With a low risk of a significant inflation rebound, the Federal Reserve is expected to resume its rate-cutting cycle in September, with three 25-basis-point cuts anticipated by year-end. In this accommodative monetary environment, the likelihood of a U.S. stock market crash is extremely low. Recently, U.S. economic growth has shown mixed pictures: after negative GDP growth in the first quarter, the second quarter rebounded to 3%, driven by a recovery in net exports, though this growth lacks sustainability. The Consumer Confidence Index has generally exhibited a weak trend, but recent data shows signs of improvement. Manufacturing PMI indicates ongoing contraction, yet the services sector shows strong resilience. Labour market job growth has fallen short of expectations, with significant downward revisions to prior data, but the unemployment rate remains low. While the overall economic outlook is not particularly optimistic, the probability of a technical recession is minimal, and the likelihood of a deep stock market correction is similarly low. The yield curve is now largely normalised, with only the 1-3-year segment still inverted, a significant improvement from the severe inversion a year ago, driven by declining short-term yields and rising long-term yields. As a result, the risk of a yield curve inversion triggering a sharp market decline is steadily decreasing.
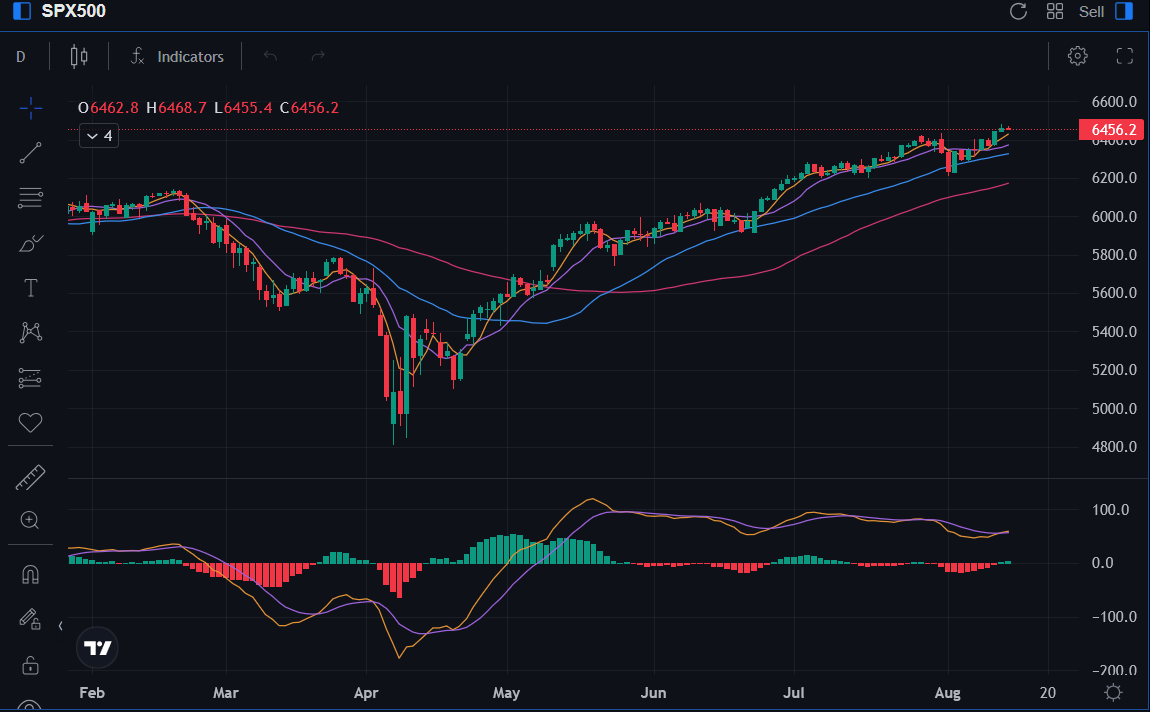
In summary, despite the current high valuations and leverage levels in the U.S. stock market, which are near historical peaks, the Federal Reserve’s anticipated resumption of rate cuts, the low likelihood of a technical recession, and the significant improvement in the U.S. Treasury yield curve inversion suggest that the probability of a stock market crash in the short to medium term (0–12 months) is extremely low. Should the U.S. stock market experience a temporary, phase-like correction similar to the one seen from February to April this year, it would present a favourable opportunity for medium-term bullish investors to enter the market.
Source: Mitrade
1. Introduction
Following the S&P 500’s breakthrough above 6,450 points and its continued rise to record highs, Wall Street institutions such as Morgan Stanley, Deutsche Bank, and Evercore ISI have issued warnings. They highlight that the current high valuations in the U.S. stock market, combined with the gradual slowdown in the U.S. economy, could trigger a significant correction. This article will delve into economic principles and draw on historical lessons to thoroughly analyse whether the U.S. stock market is genuinely at risk of a deep correction.
* For related information, refer to the article published on 11 August 2025, titled “"Buyback Addiction": US Share Repurchases Set to Smash $1 Trillion Record in 2025”
2. Warning Signals Before a Stock Market Crash
2.1 Federal Reserve Rate Hikes
Theoretically, a series of warning signals consistently precedes significant stock market corrections or crashes. The primary signal is high inflation, which prompts the Federal Reserve to implement sustained interest rate hikes. When inflation surges, the Fed typically raises rates to curb it, directly increasing borrowing costs for businesses and individuals. For companies, higher financing costs can lead to reduced investment; for individuals, elevated mortgage and consumer loan payments often dampen spending. This dual cooling of investment and consumption creates a bearish outlook for the stock market. Historically, the Federal Reserve’s rate hikes and the resulting liquidity contraction played a pivotal role in four major market downturns: the 1929 Great Depression, the 1987 Stock Market Crash, the 2000 Dot-Com Bubble Collapse, and the 2008 Global Financial Crisis.
2.2 Economic Recession
The second warning signal is an economic recession. A recession leads to reduced business output, lower capacity utilisation, and a decline in consumer spending as households cut back on non-essential expenses. These shifts directly erode corporate revenues and profits, exerting downward pressure on stock prices. However, key economic indicators such as GDP and industrial output are typically lagging, often only reported after a significant market correction has already occurred. Therefore, anticipating macroeconomic trends in advance is the true critical signal for predicting stock market movements.
2.3 Yield Curve Inversion
The third warning signal is a yield curve inversion, where short-term bond yields exceed long-term bond yields, defying the typical pattern of higher long-term rates. This phenomenon reflects investors’ pessimistic expectations for future economic growth. Additionally, a yield curve inversion significantly compresses commercial banks’ profit margins, as banks typically borrow at short-term rates to fund deposits and lend at long-term rates; a narrower spread directly reduces profitability. This indicator accurately foreshadowed the crises of 2000 and 2008, making it a critical reference signal for predicting stock market crashes.
2.4 High Valuations + High Leverage
Beyond macroeconomic factors, stock markets often exhibit signs of excessive speculation before a crash. For instance, after prolonged and substantial stock price increases, the "herd effect" can lead to overvaluation. Another manifestation is excessive leverage, which refers to stock trading using borrowed funds. Once the market enters a downward trend, a chain reaction is triggered: brokers will demand investors to add margin. If investors lack spare capital, they are forced to liquidate their stock positions. This, in turn, drives stock prices further downward, creating a vicious cycle. Before the four major stock market crashes since the 1920s, the market was in a state of extreme frenzy.
2.5 The Federal Reserve Remains the Most Critical Factor
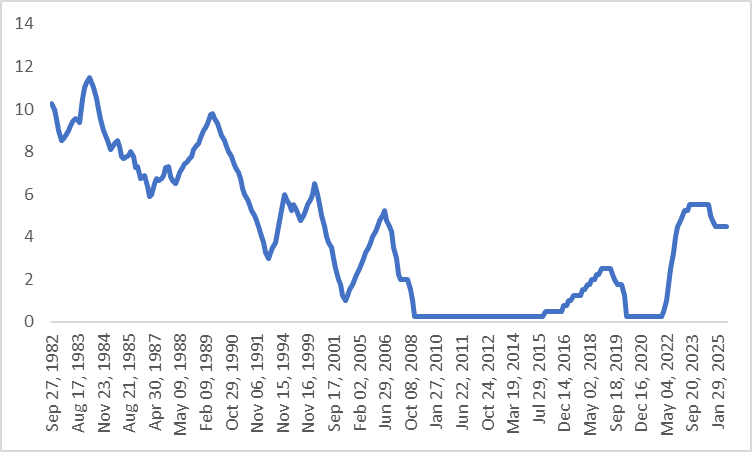
We believe that the most crucial among these signals is still the interest rate hikes by the Federal Reserve. Before each of the four largest stock market crashes in history, the Federal Reserve entered an interest rate hike cycle to combat inflation. The tightening of monetary policy led to a depletion of market liquidity, which in turn triggered the stock market crashes (Figure 2.5.1).
To draw an analogy: high valuations and high leverage are like flammable dry firewood. The market will not ignite on its own just because there is a lot of dry firewood; it still needs a spark to set it off — and that spark is the Federal Reserve’s interest rate hikes. It is the combination of dry firewood and the spark that ultimately ignites the raging flames of a market crash.
Objectively speaking, as can be seen from Figure 2.5.2, Federal Reserve rate hikes do not necessarily trigger stock market crashes, but every stock market crash has been accompanied by sustained rate hikes by the Federal Reserve. Next, we will review history and explore the pivotal role played by the Federal Reserve in the stock market through the lens of historical records.
Figure 2.5.1: Fed's Rate Hiking Cycles Before the Four Stock Market Crashes
.jpg)
Source: Refinitiv, TradingKey
Figure 2.5.2: Fed Policy Rate (%)
Source: Refinitiv, TradingKey
3. The Four Major Stock Market Crashes in History
3.1 The Great Depression of 1929
At that time, the United States was in the "Roaring Twenties," presenting a scene of prosperity on the surface. However, in reality, the entire society was borrowing money to invest in the stock market, and speculative activities had reached a frenzied level. Starting from early 1928, the Federal Reserve continuously raised its benchmark interest rate from 3.5% to 6% to cool down the economy and curb demand-pull inflation. The rising financing costs sowed hidden risks in the economy itself. Eventually, on "Black Tuesday" in October 1929, the stock market collapsed entirely, marking the beginning of a decade-long Great Depression.
3.2 The 1987 Stock Market Crash
The "Black Monday" of 1987 was the first market crash triggered by computer algorithms. At that time, a strategy known as portfolio insurance was prevalent: when stock prices fell, computers would automatically execute stock sell orders to stop losses. When this program was used by millions of investors simultaneously, even a slight decline would generate a flood of sell orders. Concurrently, the Federal Reserve had initiated an interest rate hike cycle to curb inflation. This move, combined with the aforementioned scenario, directly triggered a market flash crash, with the Dow Jones Industrial Average plummeting by as much as 22% in a single day. Fortunately, Alan Greenspan took swift action, immediately announcing interest rate cuts and injecting liquidity into the market, thereby preventing the economy from sliding into a more severe recession.
3.3 The Burst of the Dot-Com Bubble in 2000
The core driver behind the dot-com bubble in 2000 was the narrative of the "new economy". During that period, whether a company was profitable was not the key factor; as long as it had any connection with the Internet, its stock price could soar. The price-to-earnings ratio of the Nasdaq once surged to 100 times. And it was still the Federal Reserve that put an end to this frenzy. The continuous interest rate hikes starting from 1999 drained market liquidity, eventually pricking the bubble. The Nasdaq Composite Index plummeted 77% from its peak, and most Internet companies went bankrupt in the aftermath.
3.4 The 2008 Global Financial Crisis
The 2008 global financial crisis was triggered by the U.S. housing market. Following the burst of the dot-com bubble in 2000, the Federal Reserve implemented a series of interest rate cuts to stabilize the economy, lowering the federal funds rate to a historic low of 1% by June 2003. In the years that followed, while rates saw slight increases, they remained relatively low. Fuelled by significant rate cuts and a prolonged low-interest environment, housing prices surged irrationally, leading banks to issue a flood of subprime mortgages. More critically, Wall Street used complex financial innovations to package these risky loans into seemingly high-quality financial products, which were then sold to global investors. When the Federal Reserve began raising interest rates to combat inflation, housing prices fell, causing this financial chain to collapse. The bankruptcy of Lehman Brothers ultimately became the pivotal event that intensified the global financial crisis.
4. Assessing Risks in current U.S. Stock Market
4.1 Federal Reserve Monetary Policy
As summarised above, the Federal Reserve's monetary policy has a substantial influence on the U.S. stock market. The recently published U.S. inflation figures for July revealed that the headline CPI and core CPI reached 2.7% and 3.1% respectively, largely aligning with market projections. Regarding the future trend, while American companies will shift tariff costs to consumers, the actual impact of Trump's tariffs has been milder than earlier expectations. This slower pace of cost transfer will result in a more gradual boost to prices from tariffs. Furthermore, the rising rental vacancy rate and a softening labour market have also led us to maintain an optimistic view on the prospects of U.S. inflation.
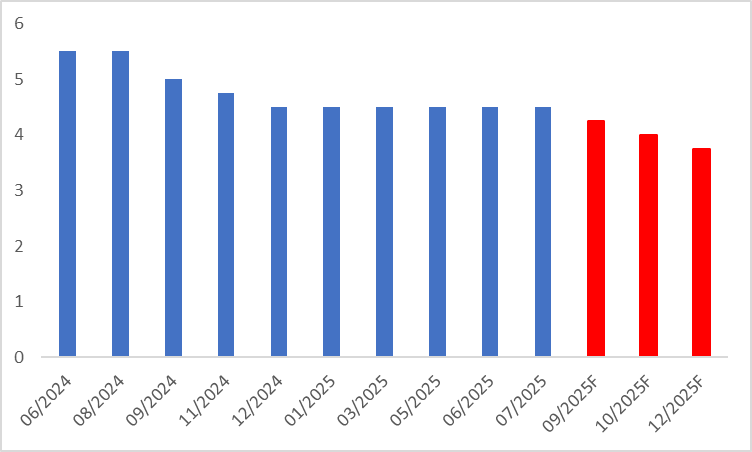
Given the low risk of a substantial inflation rebound, we project that the Federal Reserve will restart interest rate reductions in September, with three cuts to be implemented within the year—each by 25 basis points (Figure 4.1). Against the backdrop of the Federal Reserve continuing its accommodative monetary policy, the likelihood of a U.S. stock market crash is extremely low.
Figure 4.1: Fed Policy Rate Forecast (%)
Source: Refinitiv, TradingKey
4.2 Low Possibility of Experiencing a Technical Recession
In terms of economic growth, the recent performance of the U.S. economy has been a mix of positives and negatives. The annualised quarter-on-quarter growth rate of real GDP in the first quarter of this year was -0.5%, but the figure rebounded significantly to 3% in the second quarter. However, this strong performance is mainly driven by a substantial recovery in net exports, which resulted from the fading of the earlier “rush import” effect. Such growth lacks sustainability.
Regarding high-frequency data, the Consumer Confidence Index has shown an overall downward trend, falling from a peak of 111.7 in November last year to a low of 86 in April this year. On a positive note, recent data indicates a rebound, with the latest figure for July rising to 97.2. On the business side, the manufacturing PMI in July remained below the 50 threshold, while the services PMI, which serves as a pillar of the U.S. economy, recorded 55.7, demonstrating strong resilience. In terms of the labour market, nonfarm payrolls increased by 73,000 in July, significantly below the expected 104,000. Additionally, the figures for May and June were revised downward substantially, yet the unemployment rate remained at a historically low level of 4.2%.
Overall, while the outlook for the U.S. economy is not optimistic, the possibility of slipping into a technical recession remains extremely low. This further indicates that the probability of a deep correction in U.S. stocks is small.
4.3 Significant Improvement in the Yield Curve
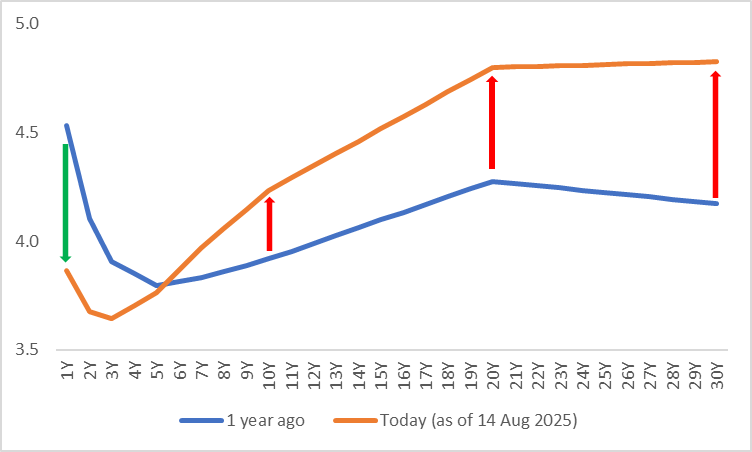
Observing the current yield curve, it presents an overall normal pattern, with only the front end (1-3 years) still in an inverted state. Compared with the data from a year ago, the shape of the current curve has improved significantly: short-term Treasury yields have declined markedly, while long-term yields have risen noticeably (Figure 4.3). As a result, the possibility of a sharp stock market decline caused by an inverted yield curve is gradually decreasing.
Figure 4.3: US Treasury Yield Curve (%)
Source: Refinitiv, TradingKey
5. Conclusion
In summary, although current U.S. stock valuations and leverage ratios are both in historically high ranges, against the backdrop of the Federal Reserve restarting an interest rate cut cycle, a low probability of a technical recession, and a significant improvement in the inversion of the U.S. Treasury yield curve, we judge that the probability of a U.S. stock market crash in the short to medium term (0-12 months) is extremely low. If U.S. stocks experience a brief and phased correction in the short term, similar to that from February to April this year, it would precisely present a good opportunity for medium-term long-position entries.
