

The Coca-Cola Company: Margin Machine Hidden Behind Modest Growth

- Coca-Cola's Q1 2025 operating margin rose 204 basis points to 34.6%, despite a 2% revenue decline.
- Global unit case volume grew 2%, led by India, China, and Brazil, while North America volumes declined 3%.
- Studio X and refranchising contributed to 96bps non-GAAP gross margin expansion and enhanced cost leverage across emerging markets.
- Operating income rose 71% YoY; SG&A fell 4%, and GAAP free cash flow excluding fairlife reached $558 million.
TradingKey - On initial inspection, Coca-Cola's Q1 2025 results look ordinary. Net revenues declined 2%, North American volumes decreased 3%, and comparable EPS increased only 1% to $0.73 on the back of industry-leading operating margin growth. But behind those surface statistics lies a lopsided opportunity: Coca-Cola’s hyper-local operating model is quietly strengthening its strategic position in a time of geopolitical pushback and the normalization of inflation.
Coca-Cola is not just weathering turbulence; it is optimizing its cost base, refranchising bottling assets, and executing digital marketing through Studio X to preserve pricing power and market share in a polarized world economy.
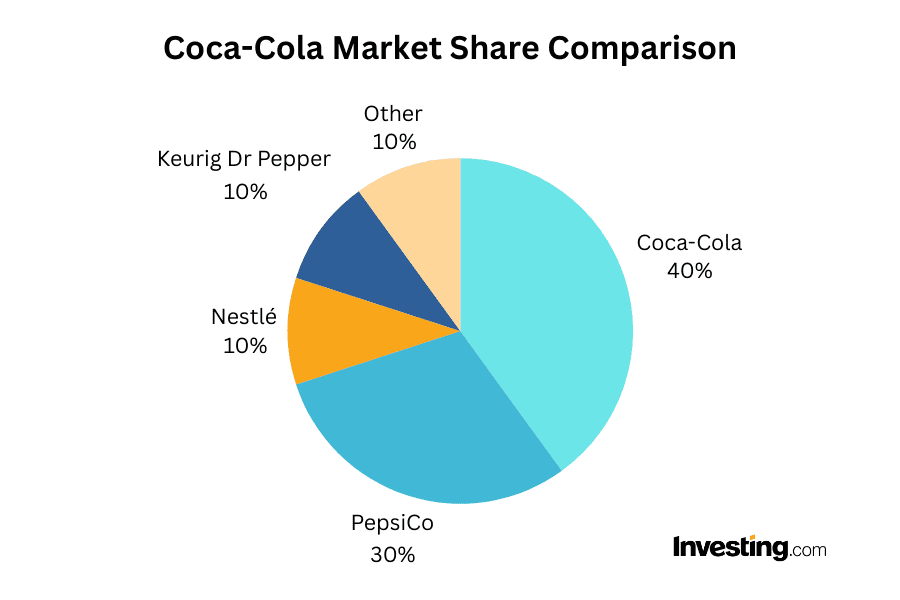
Source: Investing.com
While headlines revolve around modest topline growth, Coca-Cola's operating margin quietly increased 204 basis points year over year to 34.6%, a level rarely seen in recent history. Coca-Cola generated $558 million in free cash flow (excluding the one-time $6.1B fairlife payment) and maintains net leverage of just 2.1x EBITDA. This gives the company flexibility to expand locally and protect global brands through subtle, culturally attuned campaigns.
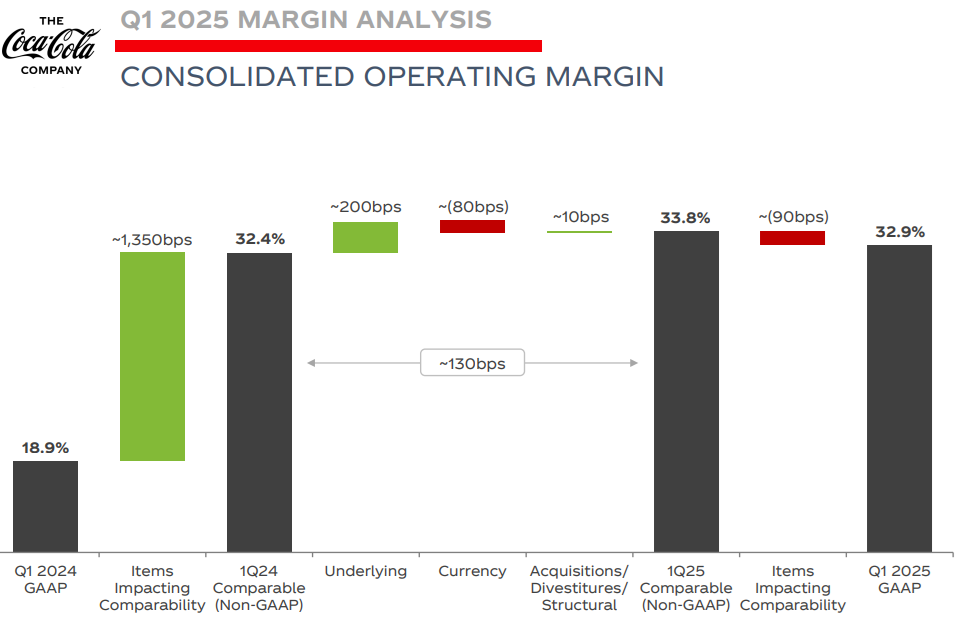
Source: Coca Cola IR (Margin Analysis)
Its brand ecosystem now includes 30 billion-dollar brands, with Coke Zero Sugar up 14% YoY and fairlife maintaining industry-leading retail dollar growth. With growing strength in India, Türkiye, and the Philippines, Coca-Cola is converting geopolitical headwinds into localization tailwinds. Institutional investors focusing solely on headline EPS risk missing the compounding operating leverage being quietly built through structural shifts and an AI-enhanced marketing stack.
The Portfolio Engine: Granular execution meets Structural tailwinds
Coca-Cola's operating model is designed for execution across divergent market cycles. In Q1, global unit case rose 2% led by India, China, and Brazil, while North American volume declined. Despite regional differences, international organic revenue grew 6%, with pricing/mix up 5%, even in markets where inflation is moderating. This reflects Coca-Cola's mature revenue growth management (RGM) that now combines affordability offerings with premiumization and digital engagement.
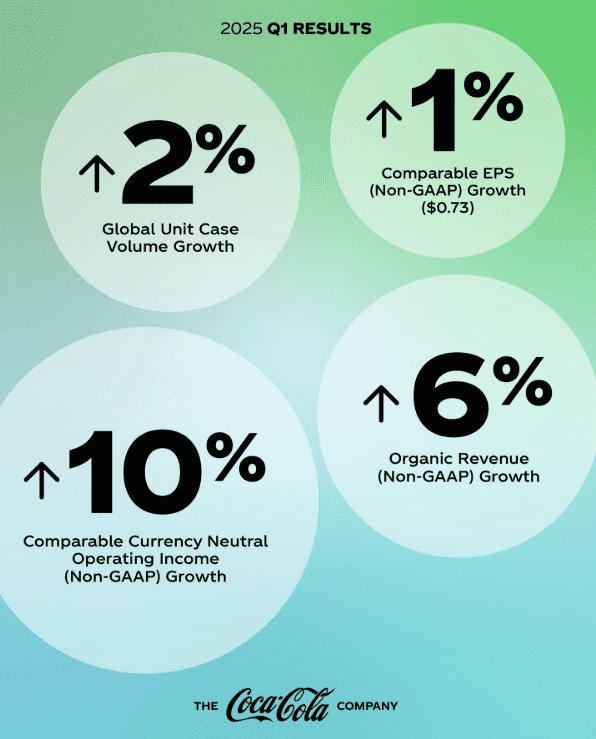
Source: The Coca Cola Company
Region-wise, North America was hit by consumer sentiment attitudes and misinformation campaigns against its flagship brand. These were offset by double-digit growth in Türkiye and Asia Pacific, with "Studio X" and Lunar New Year-themed activations drove Trademark Coca-Cola and Sprite growth. India stood out, with 6% growth in volume and almost 350,000 new points of sales, showcasing its distribution power and investments in cold drink assets and digital ordering systems.
.jpg)
Source: Alpha Street
Refranchising bottlers contributed 30–70 basis points of gross and operating margin expansion, notably in the Philippines. Excluding the impact of refranchising and other adjustments, Coca-Cola's non-GAAP gross margin increased 96 basis points YoY to 63.2%, driven by organic growth and improved commodity cost management. These results highlight not just margin resilience but the strength of Coca-Cola’s capital-light model in structurally lifting return on invested capital.
Refranchising and Cost Control: Margin Expansion with Strategic Ammunition
Coca-Cola’s Q1 results show a company squeezing efficiency gains from every angle and directing capital into high-return projects. Operating income climbed 71% YoY on a reported basis; yet even excluding one-offs and currency effects, comparable currency-neutral operating income rose 10%. This growth was driven by a 134 basis points rise in comparable operating margin and a 204 basis points rise in underlying operating margin, which is proof of precise execution and not fleeting wins.
This margin expansion was not just a matter of deferrals in marketing. Management credited timing effects but stressed longer-term gains in productivity from cost discipline, local sourcing levels, and digitized workflows. SG&A fell 4% YoY and gross profit margins increased despite a 2% revenue decline. In the meantime, the company confirmed it was capable of reinvesting in margin gains in developed markets, such as in the U.S. and Western Europe, without detracting from overall profitability. Notably, in North America there was a remarkable 170% lift in GAAP operating income in the face of declining volumes, implying higher cost absorption and effective SKU mix improvement.
The Fairlife transaction contributed to a one-off $6.1B payment and negative $5.5B free cash flow result on a GAAP basis, which might seem alarming at first sight. Excluding that one-off item, Coca-Cola generated $558M of free cash flow, and there is no evidence of underlying deterioration in cash generation. With $13.8B in cash and marketable securities and net debt at just 2.1x EBITDA, Coca-Cola has ample capacity for bolt-on acquisitions or capital returns if macro conditions remain stable.
Disconnection of Valuation: How the Market Misprices Margin Resilience
Coca-Cola trades at 24.28x forward non-GAAP and 29.18x trailing GAAP P/E, which is expensive compared to sector averages of 16–21x.On a forward EV/EBITDA basis, KO is priced at 23.11x , almost twice the sector median of 13.48x. Its forward Price/Sales ratio of 6.44x is roughly 4.5x higher than the sector median of 1.16x.
However, when compared to its own five-year historical averages, these premiums appear less extreme. P/E (FWD) is only 0.36% above its 5Y average of 24.19x, while EV/EBITDA (FWD) is 2.73% below its 5Y average of 23.76x.
Such relative overvaluation in surface multiples conceals a deeper shift: Coca-Cola is transforming from being a low-margin, low-growth drink conglomerate to a high-margin, capital-lite operating model with more than 34.6% working operating margin and free cash flow generation that is resilient even to macro and FX drag. The PEG ratio has compressed to 4.07 from its five-year average of 4.68, implying that growth is undervalued relative to its improving fundamentals.
Additionally, the company is trading at a 12.43x price/book multiple that is quite higher than peers, although warranted by ROIC levels and brand asset concentration that are unrivaled in the industry.
At $72.55 per share, Coca-Cola’s current price bakes in volume and currency concerns but fails to account for the operational momentum behind Fairlife, Studio X, and structurally improving margins. Guidance in 2025 of 5–6% organic revenue growth and 7–9% currency-neutral growth in EPS justifies a forward a forward earnings multiple of 26–28x, pointing to a fair value target of $76–82, with upside from current levels even with valuation screening on "expensive" traditional metrics.
Conclusion: A Quiet Compounder in a Market Focused on Noise
Investors focused on traditional P/E multiples risk misjudging the structural profitability and strategic agility Coca-Cola is quietly unlocking. Despite short-term volume headwinds, the company is steadily repositioning itself as a high-margin, capital-light giant with strong optionality in emerging markets and digital-led brand growth.
Trading at historical multiples of earnings, the stock has asymmetric upside available to long-term investors willing to look past currency volatility and topline noise. With a robust balance sheet, margin inflection, and expanding global relevance, Coca-Cola is emerging as one of the most attractive large-cap consumer staples plays to enter the second half of 2025.
Recommended Articles


Comments (0)
Click the $ button, enter the symbol, and select to link a stock, ETF, or other ticker.