

Ethereum Price Prediction: Regulatory Tailwinds Struggle to Counter Outflows, Bears Target $1,500


AI Podcast
Ethereum exhibits a weak and volatile trend, with a monthly decline exceeding 5%. Regulatory developments like the Clarity Act and President Trump's executive order offer mixed signals for the crypto market. Institutional buying has shifted from accumulation to retreat, with U.S. spot Ethereum ETFs experiencing net outflows since mid-May. This suggests institutional capital is rotating positions rather than exiting entirely. Market sentiment leans bearish, with Binance's Fear and Greed Index at 40. Technical indicators, including a 'death cross' formation, reinforce bearish momentum. The short-term trend targets the January low of $1,747.80, with potential further downside to $1,400-$1,500 if support fails.

TradingKey - Ethereum's recent price action has exhibited a volatile and weak trend. Although it surged to nearly $2,400 earlier this month, it faced selling pressure and retreated last week. As of press time, the cumulative decline for the month has exceeded 5%, indicating that market sentiment remains skewed toward the bears.
From a fundamental perspective, regulatory variables remain a medium-term support for Ethereum.
On May 14, the U.S. Senate Banking Committee advanced the Clarity Act, which is regarded as a significant regulatory move for the crypto market. However, the bill still faces controversies regarding anti-money laundering and conflicts of interest, leaving its eventual passage uncertain.
Shortly after, President Trump signed an executive order this Tuesday (May 19), urging the Federal Reserve and regulators to re-evaluate rules for fintech and non-bank institutions accessing payment systems. For the crypto market, this represents a relatively positive institutional signal.
From a liquidity perspective, the most significant change is that institutional buying has shifted from continuous accumulation to a phased retreat. U.S. spot Ethereum ETF saw 10 consecutive days of net inflows in April, indicating that institutional capital was consistently covering ETH exposure; however, this trend has clearly reversed by mid-May. Since May 11, Ethereum-related ETFs have recorded net outflows for seven consecutive trading days.
Furthermore, data from CoinShares on May 18 showed that global digital asset products recorded a net outflow of $1.07 billion last week, with Ethereum-related products seeing outflows of $249 million. However, in the preceding week, ETH recorded a net inflow of $77.1 million, suggesting that institutional capital has not exited entirely but is instead rotating between long and short positions at relatively high levels.
At the same time, market sentiment is not particularly optimistic. Binance's Fear and Greed Index currently stands at 40, within the 'Fear' zone, indicating that current market sentiment leans toward the bears.
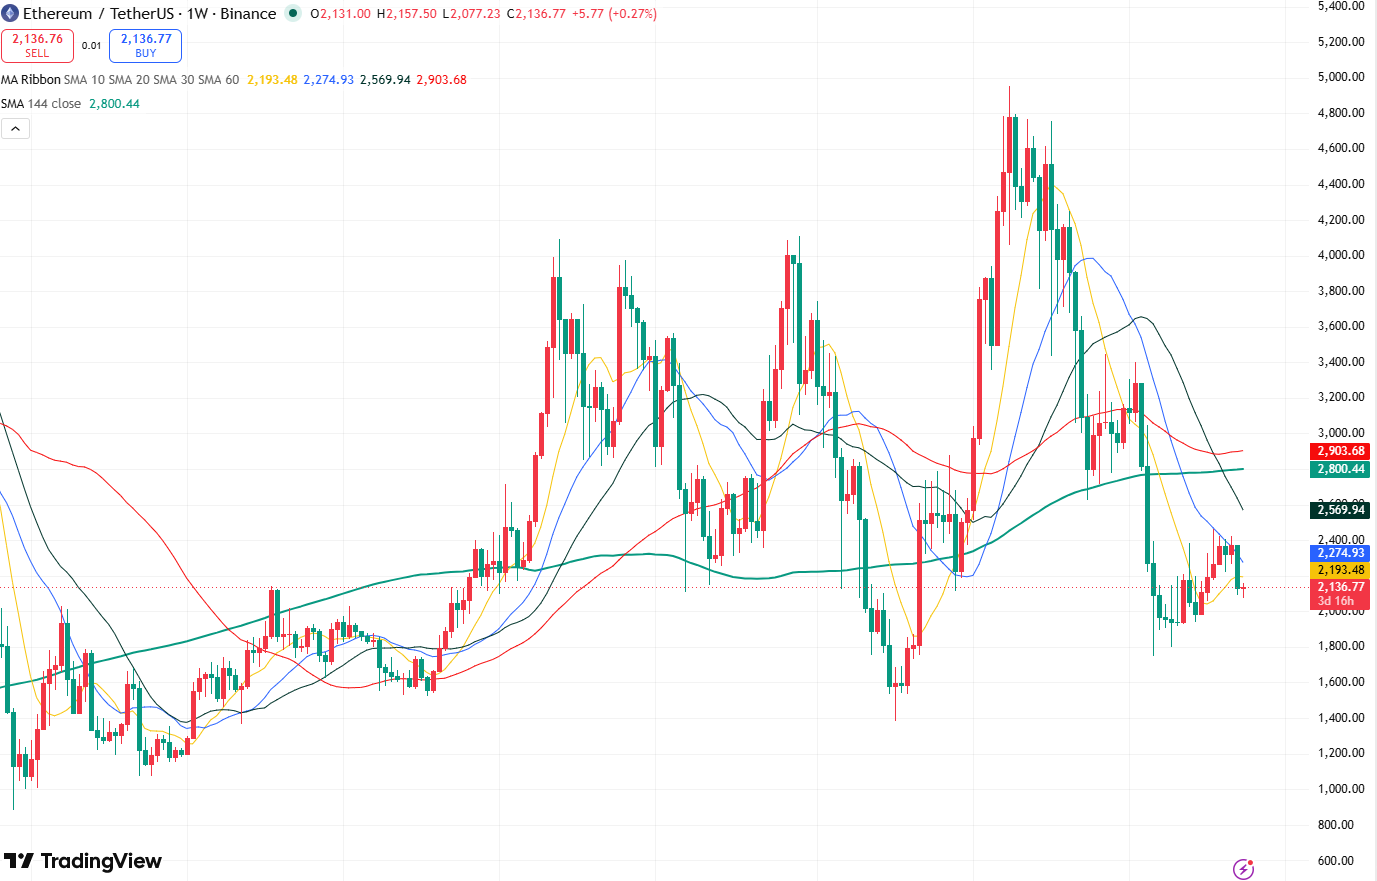
Ethereum price weekly chart, Source: TradingView
Looking at the Ethereum weekly chart, the cryptocurrency has retraced more than half of its cumulative gains of over 300% recorded between April and August last year, causing overall market sentiment to turn bearish.
Regarding the moving average system, the SMA10, SMA20, and SMA30 have all crossed below the SMA144, forming a 'death cross' structure that further reinforces the market's bearish momentum.
Meanwhile, although Ethereum's price has staged a rebound in recent weeks—briefly climbing above $2,400—it failed to successfully break through the SMA20. Last week, it closed with a long-bodied bearish candle, significantly strengthening the market's downward momentum.
Currently, Ethereum's short-term trend appears biased toward the downside. The primary target is to test the January low of $1,747.80. If this level fails to hold, the downside potential for Ethereum will open further, with the possibility of testing the support zone between $1,400 and $1,500.
Support levels: 1,747.80, 1,500.00
Resistance levels: 2,464.91, 2,623.57
This content was translated using AI and reviewed for clarity. It is for informational purposes only.
Recommended Articles


Comments (0)
Click the $ button, enter the symbol, and select to link a stock, ETF, or other ticker.