US Dollar Index Price Forecast: Safe-haven bid helps recovery above 20-day EMA ahead of US NFP



- The US Dollar Index jumps to near 101.95 as AI rout improves demand for safe-haven assets.
- Investors keenly await the US NFP data for October scheduled at 13:30 GMT.
- The impact of the US NFP data is expected to be limited on Fed’s monetary policy expectations.
The US Dollar (USD) trades sharply higher against its major currency peers as global sector rotation due to intensified sell-off in stocks related to Artificial Intelligence (AI) infrastructure has increased demand for safe-haven assets.
As of writing, the US Dollar Index (DXY), which gauges the Greenback’s value against six major currencies, trades 0.35% higher to near 101.95.
US Dollar Price Today
The table below shows the percentage change of US Dollar (USD) against listed major currencies today. US Dollar was the strongest against the Australian Dollar.
| USD | EUR | GBP | JPY | CAD | AUD | NZD | CHF | |
|---|---|---|---|---|---|---|---|---|
| USD | 0.29% | 0.34% | 0.05% | 0.38% | 0.81% | 0.75% | 0.04% | |
| EUR | -0.29% | 0.04% | -0.26% | 0.09% | 0.52% | 0.45% | -0.25% | |
| GBP | -0.34% | -0.04% | -0.30% | 0.05% | 0.48% | 0.40% | -0.30% | |
| JPY | -0.05% | 0.26% | 0.30% | 0.35% | 0.78% | 0.70% | 0.00% | |
| CAD | -0.38% | -0.09% | -0.05% | -0.35% | 0.42% | 0.35% | -0.35% | |
| AUD | -0.81% | -0.52% | -0.48% | -0.78% | -0.42% | -0.08% | -0.77% | |
| NZD | -0.75% | -0.45% | -0.40% | -0.70% | -0.35% | 0.08% | -0.69% | |
| CHF | -0.04% | 0.25% | 0.30% | -0.01% | 0.35% | 0.77% | 0.69% |
The heat map shows percentage changes of major currencies against each other. The base currency is picked from the left column, while the quote currency is picked from the top row. For example, if you pick the US Dollar from the left column and move along the horizontal line to the Japanese Yen, the percentage change displayed in the box will represent USD (base)/JPY (quote).
AI unwind sparks broad US equity rout as defensives outperform
Strategists at Danske Bank highlight that the recent “AI unwind escalated into an outright rout yesterday and took the whole US market with it,” as selling pressure spread well beyond the technology complex. They note that “the S&P 500 fell 4.4%, with every sector lower and IT leading the declines, while the Nasdaq Composite lost 5.5% and the Nasdaq 100 6.4%, its worst session since March 2020.” At the same time, Danske underscores that “defensives held up far better, so this was rotation within equities as much as money leaving them,” pointing to a pronounced shift in sector positioning rather than a uniform exit from risk assets.
On the economic front, investors keenly await the United States (US) Nonfarm Payrolls (NFP) data for October, which will be published at 13:30 GMT.
According to estimates, US employers hired 65K new workers, higher than 29K in September. The Unemployment Rate is seen as steady at 4.2%.
Average Hourly Earnings, a key measure of wage growth, is expected to have grown at a moderate pace of 2.9% Year-on-year (YoY) against 3% in September. On a monthly basis, the wage growth measure is seen rising 0.3% against the previous reading of 0.1%.
Dollar reaction to jobs data seen as increasingly uncertain
Commerzbank observes that recent payroll releases have generated a more muted and inconsistent response in foreign exchange markets, with the US currency no longer displaying a clear directional bias to labour data. As the bank puts it, “the US dollar does not seem entirely sure how to react to the labour market figures,” suggesting that, “barring any major surprises, we might be in for a fairly relaxed end to the week.”
US Dollar Index Technical Analysis
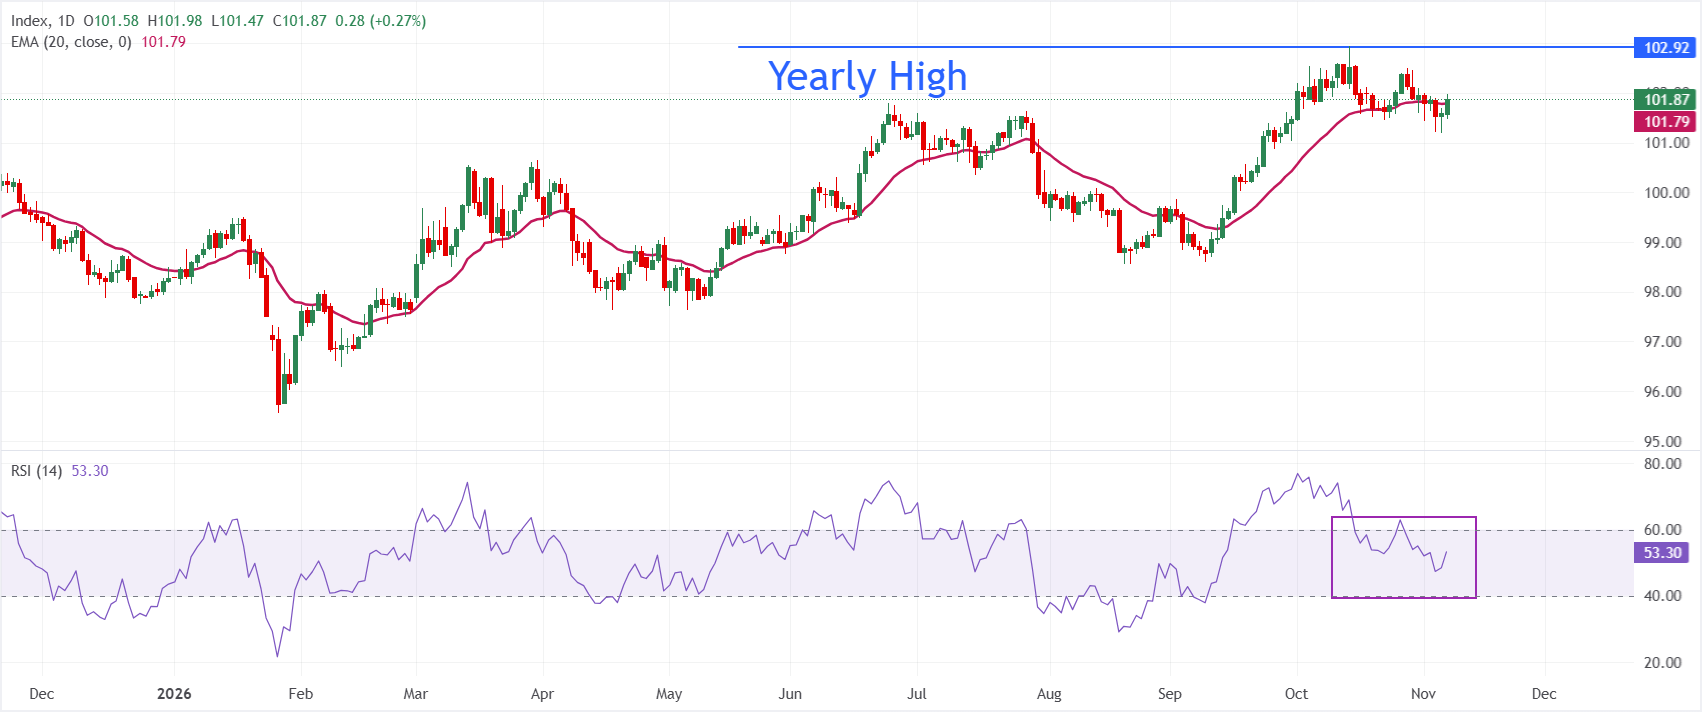
In the daily chart, Dollar Index Spot trades at 101.86. The near-term bias is modestly bullish as price holds above the 20-day exponential moving average (EMA) at 101.79, suggesting underlying demand after recent consolidation. The Relative Strength Index (RSI) at 53.26 sits in neutral territory, hinting that upside momentum is present but not overstretched.
On the downside, initial support is seen at the 20-day EMA around 101.79, with the session’s open near 101.86 acting as a nearby pivot that needs to hold to preserve the constructive tone. A sustained break below this support cluster would signal fading bullish pressure and open the door to a deeper corrective pullback towards its recent lows near 101.00. Looking up, the pair needs ato sustain above the 20-day EMA for being able to revisit the yearly high near 103.00.
(The technical analysis of this story was written with the help of an AI tool. Know more.)