US household debt hits all-time high at $18.2 trillion after a $167 billion surge in Q1

US household debt ballooned by $167 billion in the first quarter of 2025, bringing the total to a record $18.2 trillion, according to the New York Federal Reserve’s latest report.
Compared to ten years ago, the overall debt held by households has grown by $7 trillion, piling onto families who are already stretched thin. This quarter’s sharp rise came mostly from mortgage debt, which spiked by $199 billion, pushing it to a staggering $12.8 trillion.
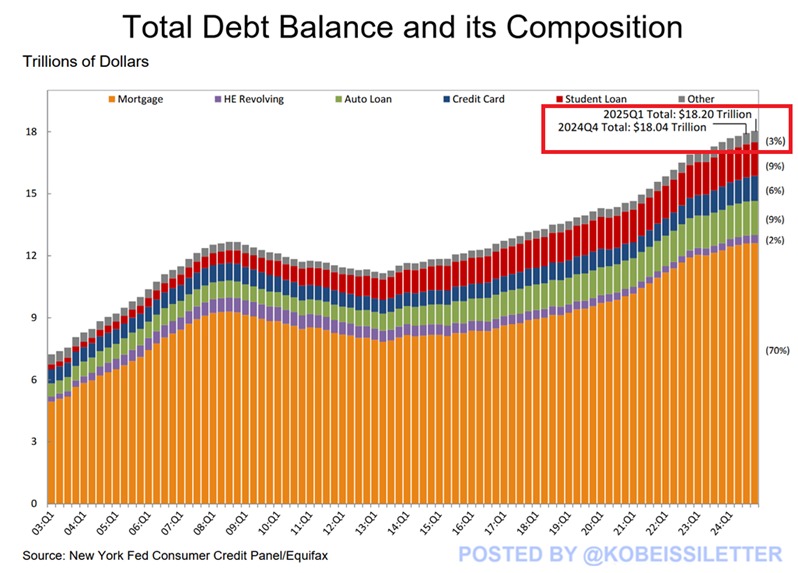
At the same time, student loan balances increased by $16 billion, hitting $1.6 trillion, another record high. Not everything went up, though. Auto loan debt dropped $13 billion, now at $1.6 trillion, and credit card balances fell $29 billion, down to $1.2 trillion. Still, the total load is heavier than it’s ever been, and it’s clear more people are locked into long-term debt with no easy exit.
Mortgage pressure rises as affordable housing stays out of reach
The current housing disaster started in the early pandemic years. Mortgage rates hit historic lows, and that sent buyers racing to lock down properties. That scramble didn’t let up. With demand so high and supply so low, prices climbed fast.
By March this year, home prices across the country were 39% higher than they were in March 2019, based on the S&P CoreLogic Case-Shiller Index.
Even now, prices are still rising. And though more homes are finally hitting the market, the supply is growing in the wrong places, mostly in higher price brackets. Meanwhile, homes in the lower and middle ranges, the ones most people actually need, are still hard to find. That has left home sales in those price tiers lagging while expensive listings keep moving.
A detailed report by the National Association of Realtors and Realtor.com tried to make sense of who can actually afford what. They focused on buyers using a standard 30-year fixed mortgage and calculated what listings would be affordable if no more than 30% of income went to the mortgage, taxes, and insurance. It’s a grim picture.
Households earning between $75,000 and $100,000 saw the biggest jump in available, affordable homes—though that only meant an increase from 20.8% of listings in March 2024 to 21.2% in March 2025. In March 2019, that same income bracket could afford 48.8% of listings.
The report said a truly balanced market would mean this group should be able to afford 48% of available homes. To reach that point now, there would need to be 416,000 more homes listed at or below $255,000.
Lower-income buyers left behind as inequality deepens
Things get worse lower down the income ladder. A household earning $50,000 could afford just 8.7% of homes for sale in March. That’s a drop from 9.4% a year earlier and way below the 27.8% back in March 2019. Buyers earning $250,000 or more? They have access to at least 80% of the market.
Danielle said most of the improvement in home supply happened in the Midwest and South, where cities like Akron, St. Louis, and Pittsburgh now have enough inventory to meet demand. Other areas—Raleigh, Des Moines, and Grand Rapids—have improved, but they’re not quite there yet.
But across the country’s top 100 metro markets, 40% are still struggling. Places like Seattle and Washington, D.C. have seen some growth in affordable listings, but buyers there still need to earn over $150,000 just to afford half of the homes available.
Markets like Austin, San Francisco, and Denver–once overheated–are now seeing better affordability. The report said that with the right mix of construction, demand changes, and local policies, progress is possible.
“It tells us that with the right mix of new construction, market shifts, and local policy efforts, even some of the most challenging markets can start to bend toward balance,” the report said.
KEY Difference Wire: the secret tool crypto projects use to get guaranteed media coverage
相关文章
高市早苗赢得日本国会大选为什么带来了日本股指暴涨,日元为什么延续贬值态势?
TradingKey - 据报道,日本首相高市早苗领导的执政联盟在周日(2月8日)举行的国会选举中已经稳赢单一政党多数席位。受消息影响,日元小幅走软,日经指数史上首次站上57000点。日本东证指数涨幅扩大至3%。
高市早苗的大选豪赌带来哪些影响?日元汇率绝地反击还是一蹶不振?
TradingKey - 2026年的开年大戏,比华尔街的预期来得更猛烈。距离2月8日的日本众议院大选仅剩最后几天,现任首相高市早苗(Sanae Takaichi)正在进行她政治生涯中最大的一次豪赌。
美元走势预测:美元指数跌破97.0至4年新低,2026年美元继续下跌还是触底反弹?
TradingKey - 2026年1月份,美元指数延续2025年的下跌走势,正式跌破97.0关键关口,最低下探至95.5,创下自2022年2月以来的近4年新低。