

XRP (XRPUSD) Suddenly Goes down 1.06% on Jun 17: What You Need to Watch

XRP (XRPUSD) is down 1.06% at Jun 17 03:05(ET), now at $1.2099, with a 7-day up of 10.69%.
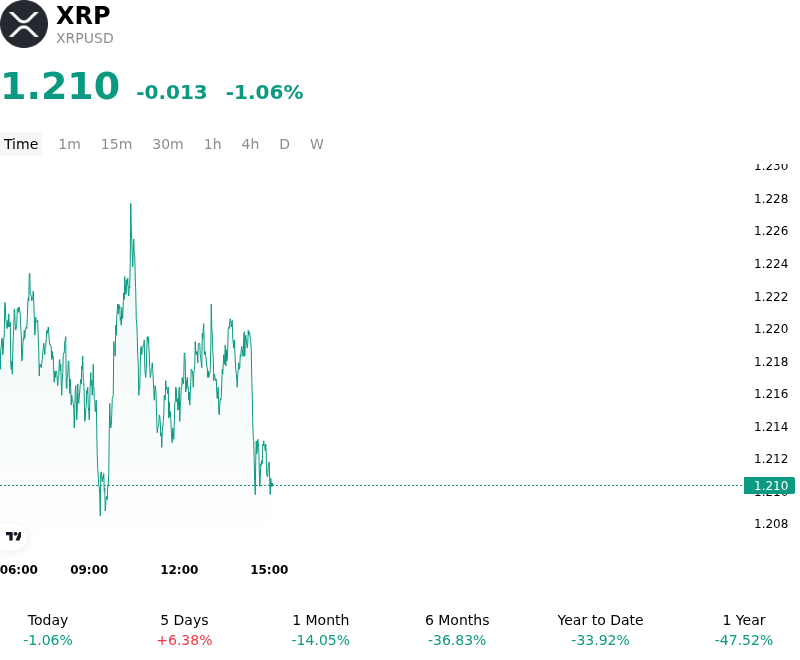
What is driving XRP (XRPUSD)’s stock price down today?
The recent price decline and elevated intraday volatility in XRP reflect a classic sell-the-news reaction following several key ecosystem milestones, alongside broader technical resistance and a shift in derivatives positioning. Specifically, the highly anticipated 3.2.0 upgrade for the XRP Ledger was successfully deployed, introducing critical enhancements such as optimized memory usage, improved node efficiency, and increased transaction throughput. While the upgrade represents a positive long-term development for the network's structural performance, institutional and retail market participants largely used the event as an opportunity to reduce exposure. The lack of an immediate, demand-driven price response post-upgrade underscores a broader market sentiment that protocol-level enhancements do not necessarily translate into immediate commercial demand for the underlying token, particularly in an environment with high stablecoin competition.
From a technical and market structure perspective, the asset remains trapped in a challenging consolidation phase, pinned below major daily moving averages. XRP has struggled to establish support above its 20-day and 50-day exponential moving averages, highlighting persistent overhead supply. The recent brief relief rally, which was catalyzed by the parent company's announcement of a $1 billion recurring operating income target for the year, quickly lost momentum. While this target signaled operational resilience and reduced dependence on programmatic token sales, it also re-emphasized the fundamental disconnect between corporate enterprise growth and direct utility-driven demand for the token. This structural ceiling has encouraged tactical sellers to defend key resistance levels, capping short-term upside.
On-chain data and leverage dynamics have further exacerbated intraday volatility. Recent metrics show that exchange-flow dynamics on major platforms have shifted, marked by a surge in withdrawal dominance alongside a significant spike in the estimated leverage ratio. This leverage ratio, reaching its highest level of the year, indicates that a substantial portion of the current trading volume is being driven by speculative, highly leveraged derivatives positioning. In a range-bound market, elevated leverage often leads to cascading liquidations and sharp, sudden price swings, prompting spot-market participants to step back and preserve capital.
Furthermore, the regulatory landscape continues to present a mixed backdrop. While optimism remains regarding the long-term implications of the CLARITY Act, which seeks to establish a clear digital commodity framework, the legislative process has shown signs of slowing down ahead of upcoming legislative sessions. This legislative stagnation, paired with steady but unspectacular inflows into spot exchange-traded funds, has left the asset without a strong macro catalyst to break its current downward-slanted consolidation. In the absence of decisive capital inflows, risk-off sentiment has dominated, leading to the observed decline as investors recalibrate their portfolios.
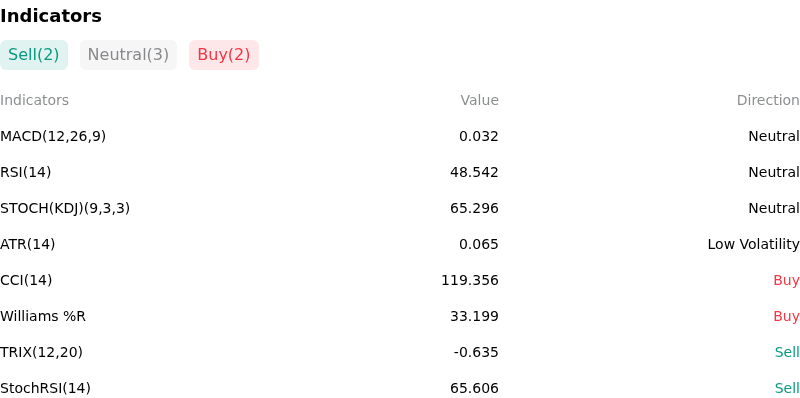
Technical Analysis of XRP (XRPUSD)
Technically, XRP (XRPUSD) shows a MACD (12,26,9) value of 0.032, indicating a neutral signal. The RSI at 48.542 suggests neutral condition and the Williams %R at 33.199 suggests buy condition. Please monitor closely.
More details about XRP (XRPUSD)
Recent Events and Risks:
- Formidable Technical Resistance and Potential Symmetrical Breakdown: Having failed to secure a clean daily close above the $1.28–$1.30 resistance cluster, which aligns closely with the 50-day Exponential Moving Average, short-term buyers have begun aggressively locking in profits. XRP's technical setup remains weak after breaking down from a multi-month symmetrical triangle, and a failure to defend the immediate $1.20 support level risks triggering a broader capitulation toward the $1.00 psychological floor.
- Dwindling Market Liquidity and Stagnant Speculative Interest: Speculative activity has cooled severely, with daily trading volumes dropping over 15% in recent sessions to $1.32 billion. Concurrently, perpetual futures Open Interest has stagnated around $2.4 billion, far below historical peaks. This lack of depth makes the token highly susceptible to sudden downside volatility, liquidity shocks, and localized leverage shakeouts.
- Regulatory Stalls and CLARITY Act Legislative Friction: While the CLARITY Act was formally placed on the Senate Legislative Calendar under General Orders, progress has slowed as lawmakers debate whether federal officials should be restricted from owning crypto assets. Because a significant portion of XRP's premium is dependent on the swift passage of this federal framework, any prolonged legislative gridlock or delays to a full Senate floor vote present a major headwind for spot market sentiment.
- Dilutive Supply Pressure from Monthly Escrow Releases: XRP continues to face structural supply-side headwinds from Ripple's scheduled monthly escrow unlocks. Despite positive spot ETF inflows, the continuous release of new tokens into the circulating supply requires sustained, high-volume demand to prevent price dilution, particularly while XRP remains constrained within a long-term descending macro channel.
This article may include AI-generated content that is human-reviewed, which is for reference and general information purposes only and does not constitute investment advice.
Recommended Articles


Comments (0)
Click the $ button, enter the symbol, and select to link a stock, ETF, or other ticker.