

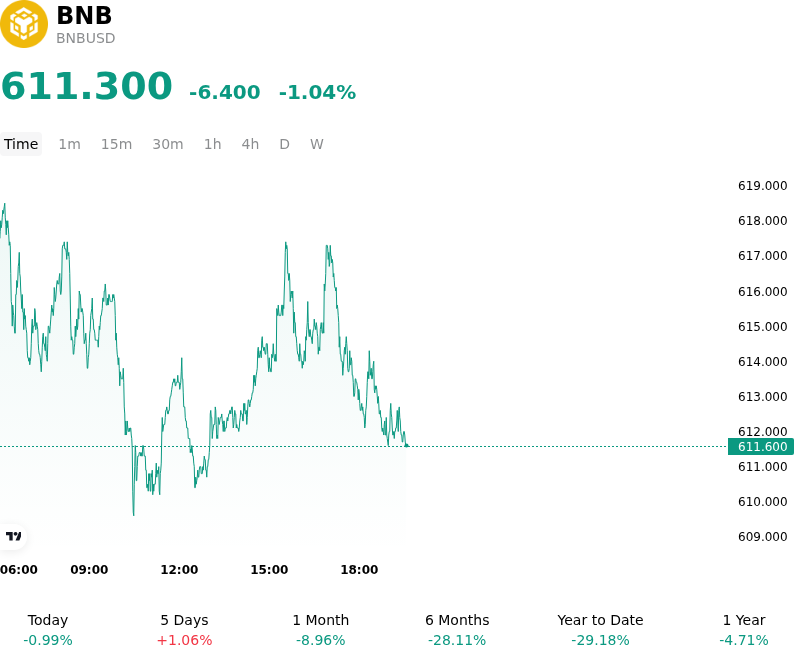
BNB (BNBUSD) Is down 1.04% on Jun 16: Why It Happened

BNB (BNBUSD) is down 1.04% at Jun 16 07:35(ET), now at $611.3, with a 7-day up of 2.67%.
What is driving BNB (BNBUSD)’s stock price down today?
The minor decline and intraday volatility in BNB can be primarily attributed to a tightening global macro environment, driven by key central bank actions. On June 16, the Bank of Japan raised its benchmark interest rate by 25 basis points to 1.0 percent, its highest level since 1995. This rate hike fueled investor anxiety regarding a potential unwind of the global yen carry trade, a mechanism that has historically supplied low-cost capital to risk assets, including cryptocurrencies. At the same time, risk appetite was further subdued as the U.S. Federal Open Market Committee commenced its highly anticipated June policy meeting. Under the newly confirmed leadership of Federal Reserve Chair Kevin Warsh, investors adopted a defensive posture, deleveraging ahead of the upcoming interest rate projections and the updated dot plot, which could signal a prolonged period of high U.S. borrowing costs.
Systemic on-chain dynamics and security developments within the decentralized finance ecosystem also weighed on investor sentiment. A recent report from Binance Research underscored that a series of major protocol exploits had triggered over $13 billion in total value locked outflows. This TVL compression raised the on-chain leverage ratio to roughly 38 percent—levels not seen since 2021—without a corresponding rise in organic borrowing demand. The increased systemic leverage against a smaller collateral base signaled heightened vulnerability across decentralized applications. Additionally, a security incident involving the Humanity Protocol forced the exchange to implement protective price smoothing mechanisms on select derivatives, reminding market participants of the persistent execution and security risks present in the digital asset landscape.
This macro-driven pullback coincided with profit-taking following a period of strong ecosystem-specific catalysts. In the days preceding the decline, the BNB Chain successfully launched bStocks, which are tokenized representations of major U.S. equities backed 1:1 in regulated custody, alongside an aggressive daily promotional campaign that acts as a fee-burning mechanism via the BEP-95 protocol. While these developments initially stimulated network transaction volumes and reinforced structural demand for BNB, the broader risk-off environment prompted short-term traders to lock in gains. Consequently, the combination of macroeconomic tightening and profit-taking overrode the positive momentum generated by these on-chain innovations, causing the asset to lose its upward trajectory.
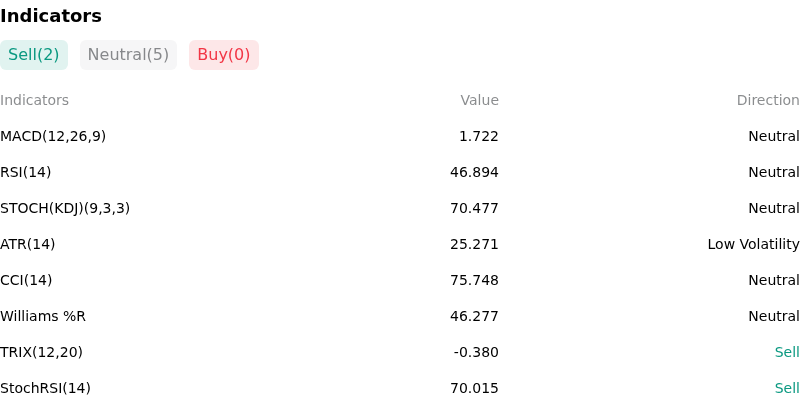
Technical Analysis of BNB (BNBUSD)
Technically, BNB (BNBUSD) shows a MACD (12,26,9) value of 1.722, indicating a neutral signal. The RSI at 46.894 suggests neutral condition and the Williams %R at 46.277 suggests neutral condition. Please monitor closely.
More details about BNB (BNBUSD)
Recent Events and Risks:
- Subdued Institutional Demand for VBNB Spot ETF: Despite hopes of a major institutional catalyst, the newly launched VanEck spot BNB ETF (VBNB) has failed to generate meaningful inflows, recording only $2 million in net inflows since its late-May debut. This stark underperformance relative to other altcoin ETFs highlights a persistent lack of institutional interest, leaving BNB without the capital inflows required to support higher valuations.
- BNB Chain Ecosystem Vulnerabilities: The network's security profile is under pressure following several high-profile protocol exploits. In addition to the $2.5 million Specter and $7.3 million DxSale hacks earlier in the month, a major $36 million compromise of Humanity Protocol on June 8, 2026, saw attackers exploit stolen Safe multisig credentials to mint and dump hundreds of millions of H tokens directly onto BNB Smart Chain liquidity pools, raising systemic security concerns.
- Bearish Derivatives Positioning and Fading Interest: Key on-chain and derivative market indicators are signaling a deep bearish bias. BNB's Social Dominance metric has fallen to just 0.019%—a low not seen since December 2020—indicating the token has fallen off traders' radars. Simultaneously, the long-to-short ratio remains heavily depressed below 1.0 (hovering around 0.84), while negative funding rates confirm that short sellers dominate the perpetual futures market.
- Vulnerable Chart Structure and Broken Weekly Support: From a technical perspective, BNB failed a crucial retest of its multi-year ascending trendline and was rejected near the upper boundary of a giant daily megaphone pattern at $720. Trading below its key exponential moving averages, the token faces a highly concentrated liquidation wall between $620 and $628. If it fails to break above this immediate resistance, technical analysts warn of an impending slide back toward the $500–$560 support zone.
This article may include AI-generated content that is human-reviewed, which is for reference and general information purposes only and does not constitute investment advice.
Recommended Articles


Comments (0)
Click the $ button, enter the symbol, and select to link a stock, ETF, or other ticker.