

Dow Jones Industrial Average recovers 300 points after AI sell-off finds footing

- The Dow Jones rebounded on Wednesday, climbing from 47,200.
- The week’s brief but severe AI plunge has recovered for the time being.
- US ISM Services PMI results and ADP labor data gave investors a confidence boost.
The Dow Jones Industrial Average (DJIA) crimped bearish flows on Wednesday, finding a near-term foothold near the 47,200 level and rising 300 points as equity markets recover following an early-week plunge in the heavily concentrated AI and tech infrastructure segments. US Purchasing Managers Index (PMI) and ADP Employment Change data prints helped to soothe investor fears about a potential economic downturn. However, several cautionary flags bear mention on Wednesday’s data docket.
AI sell-off recovers quickly
A steep sell-off in key stocks in the AI scene earlier this week sent equity markets broadly lower, briefly revealing to investors just how much of the investment world has become concentrated in a few key tech players, knocking on market sentiment even further. Palantir (PLTR) extended its mid-week decline, shedding further weight on Wednesday after falling a stunning 8% on Tuesday despite beating analyst earnings expectations. Elsewhere across the market, investor sentiment is back on the rebound, keeping indexes bid back into the green, though the Dow Jones remains down for the week.
ADP Employment Change numbers came in higher than expected, showing an estimated net gain of 42K new jobs in October compared to the previous month’s print of -29K. ADP figures have a poor track record of accurately correlating to official datasets from one release to the next, but with the US federal government in full shutdown mode with no end in sight, investors are placing additional significance on volatile private data.
PMIs up, but at what cost
The Institute for Supply Management’s (ISM) latest Services PMI showed a healthy uptick in service sector business sentiment in October, but here too lies the same volatility problem: response rates to private surveys tend to range from low to abysmal, frequently missing much of the key elements gleaned from large-scale official datasets.
October’s ISM Services PMI rose to 52.4 from 50.0, indicating an overall improvement in business activity sentiment. However, the internals of the report show rising pressure in supplier deliveries, and the inventories index contracted for a second straight month, implying service providers are struggling to get their hands on additional merchandise and materials, which could eventually show up as additional price inflation pressure further down the line.
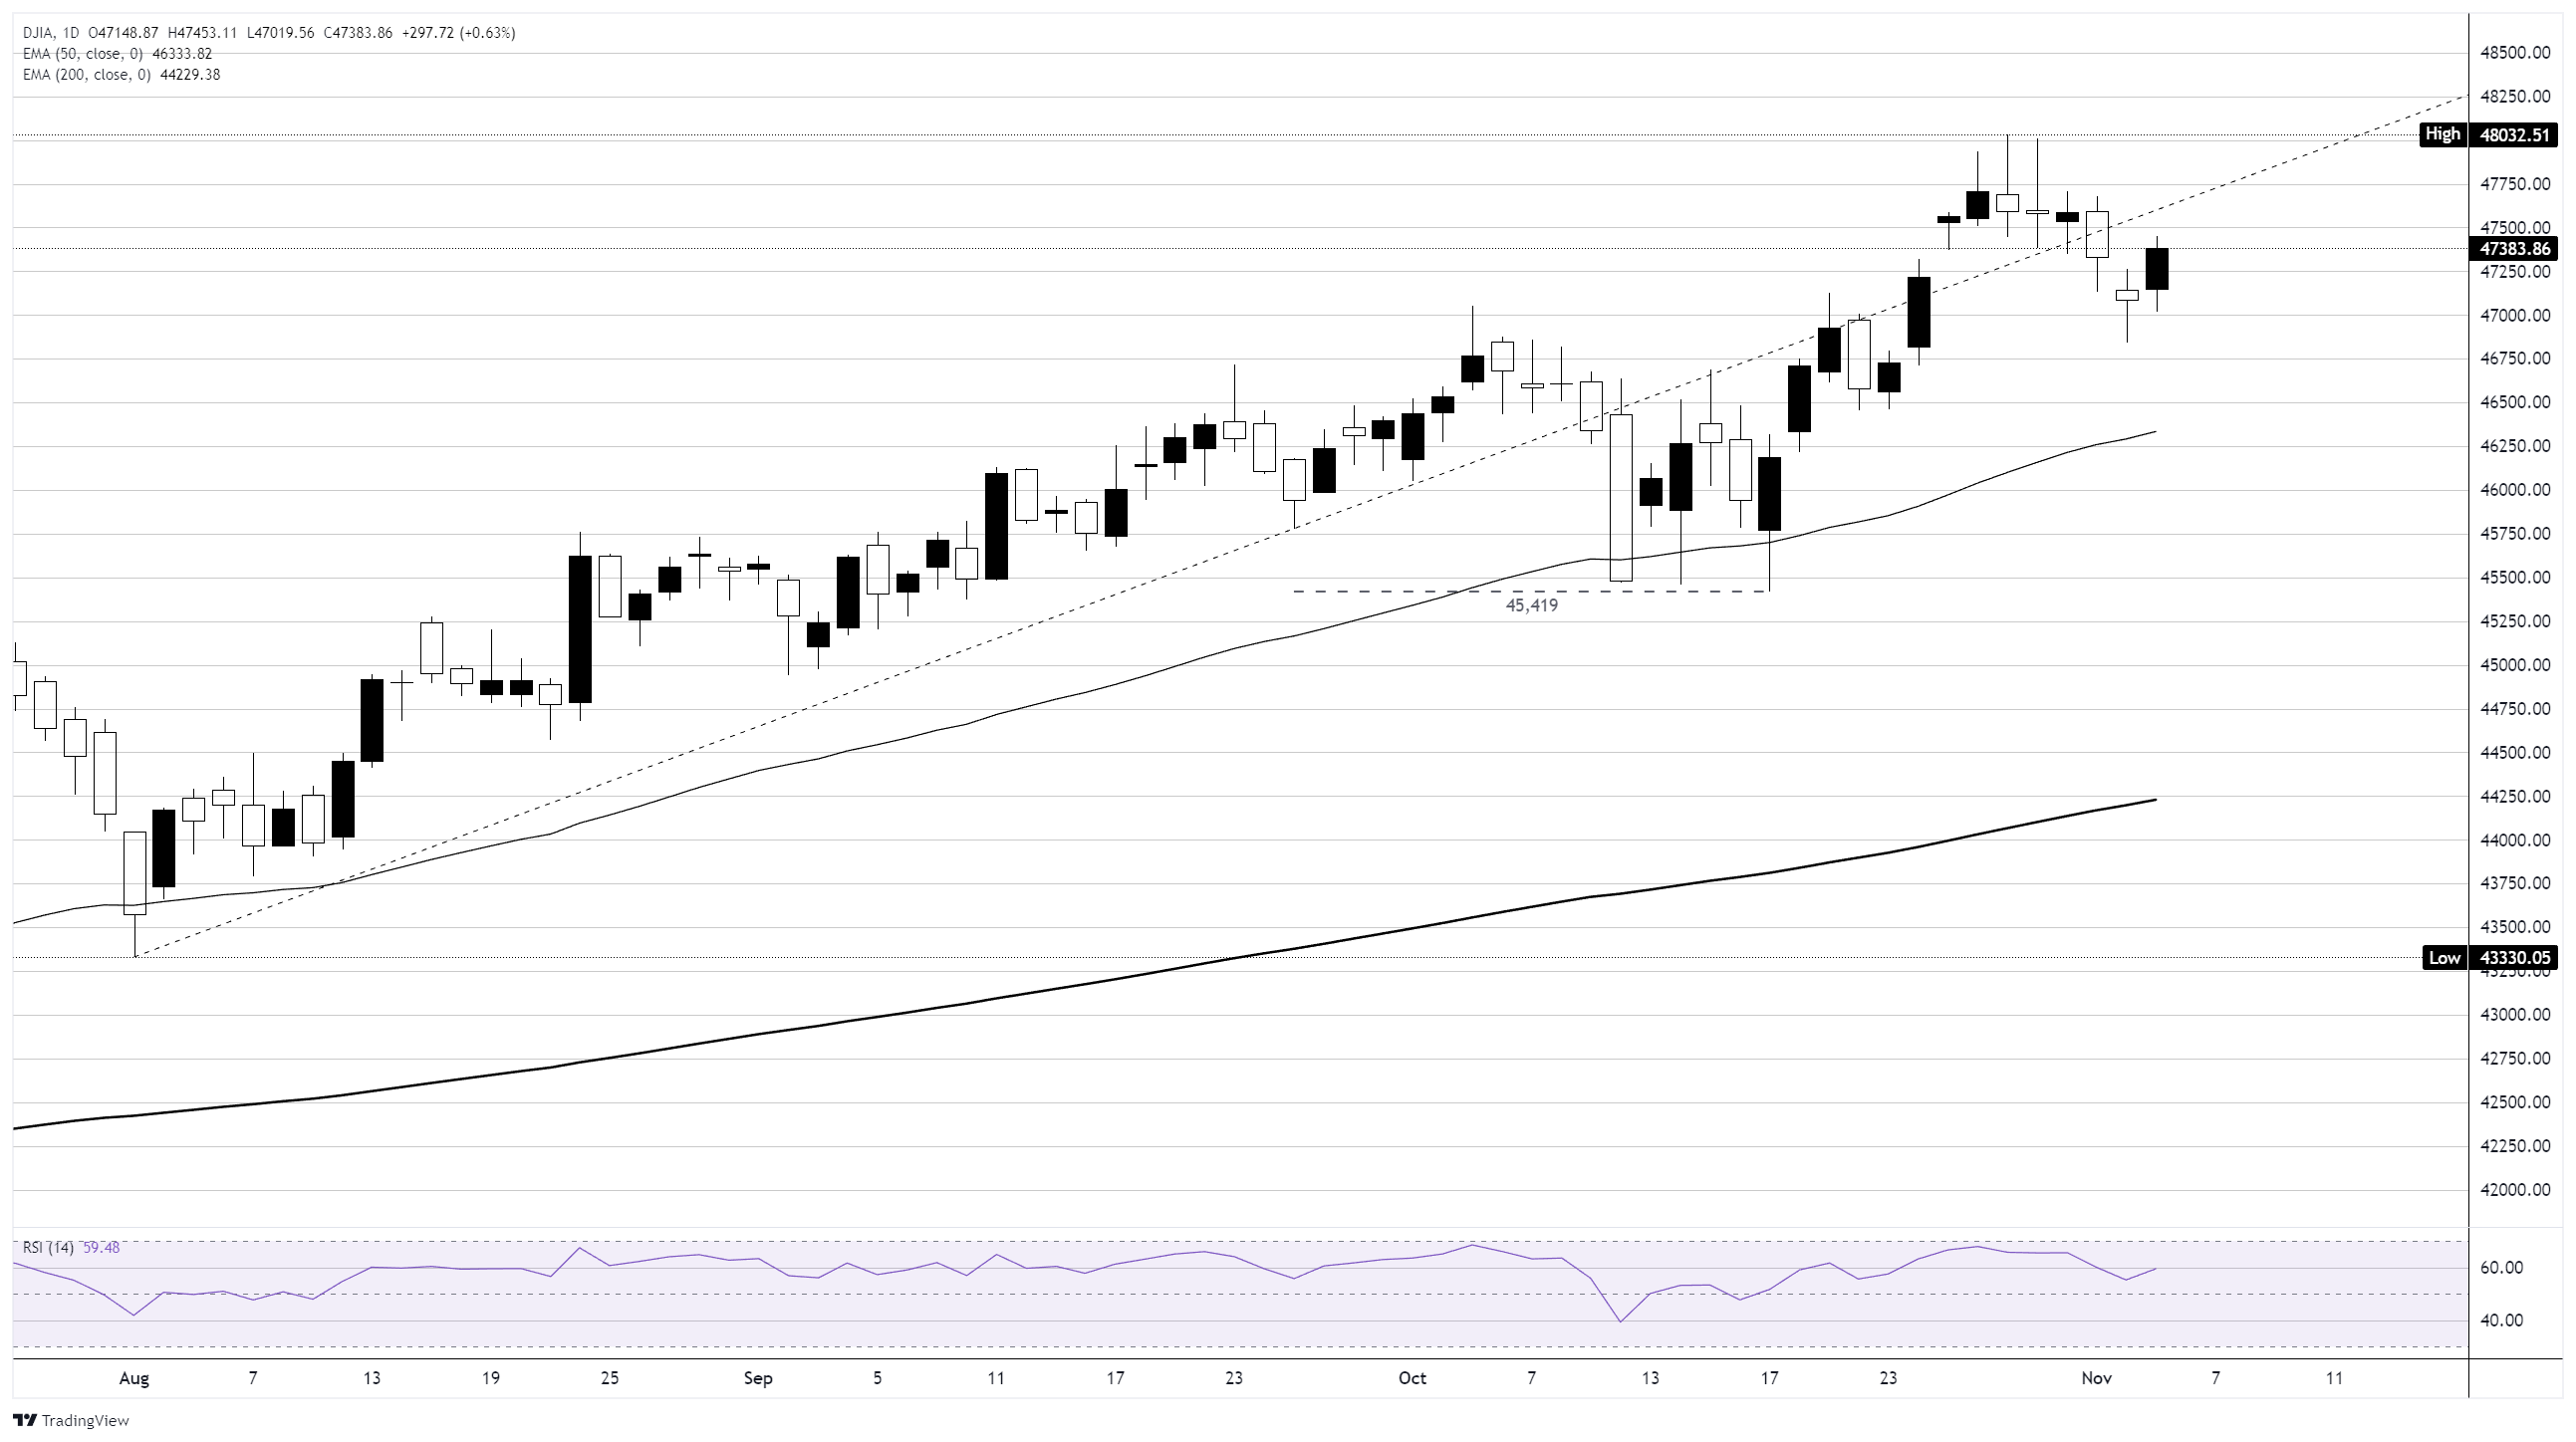
Dow Jones daily chart
Dow Jones FAQs
The Dow Jones Industrial Average, one of the oldest stock market indices in the world, is compiled of the 30 most traded stocks in the US. The index is price-weighted rather than weighted by capitalization. It is calculated by summing the prices of the constituent stocks and dividing them by a factor, currently 0.152. The index was founded by Charles Dow, who also founded the Wall Street Journal. In later years it has been criticized for not being broadly representative enough because it only tracks 30 conglomerates, unlike broader indices such as the S&P 500.
Many different factors drive the Dow Jones Industrial Average (DJIA). The aggregate performance of the component companies revealed in quarterly company earnings reports is the main one. US and global macroeconomic data also contributes as it impacts on investor sentiment. The level of interest rates, set by the Federal Reserve (Fed), also influences the DJIA as it affects the cost of credit, on which many corporations are heavily reliant. Therefore, inflation can be a major driver as well as other metrics which impact the Fed decisions.
Dow Theory is a method for identifying the primary trend of the stock market developed by Charles Dow. A key step is to compare the direction of the Dow Jones Industrial Average (DJIA) and the Dow Jones Transportation Average (DJTA) and only follow trends where both are moving in the same direction. Volume is a confirmatory criteria. The theory uses elements of peak and trough analysis. Dow’s theory posits three trend phases: accumulation, when smart money starts buying or selling; public participation, when the wider public joins in; and distribution, when the smart money exits.
There are a number of ways to trade the DJIA. One is to use ETFs which allow investors to trade the DJIA as a single security, rather than having to buy shares in all 30 constituent companies. A leading example is the SPDR Dow Jones Industrial Average ETF (DIA). DJIA futures contracts enable traders to speculate on the future value of the index and Options provide the right, but not the obligation, to buy or sell the index at a predetermined price in the future. Mutual funds enable investors to buy a share of a diversified portfolio of DJIA stocks thus providing exposure to the overall index.
Recommended Articles


Comments (0)
Click the $ button, enter the symbol, and select to link a stock, ETF, or other ticker.