

GBP/USD Price Forecast: Tests confluence zone around 1.3450 support

- GBP/USD tests the ascending channel’s lower boundary around 1.3450.
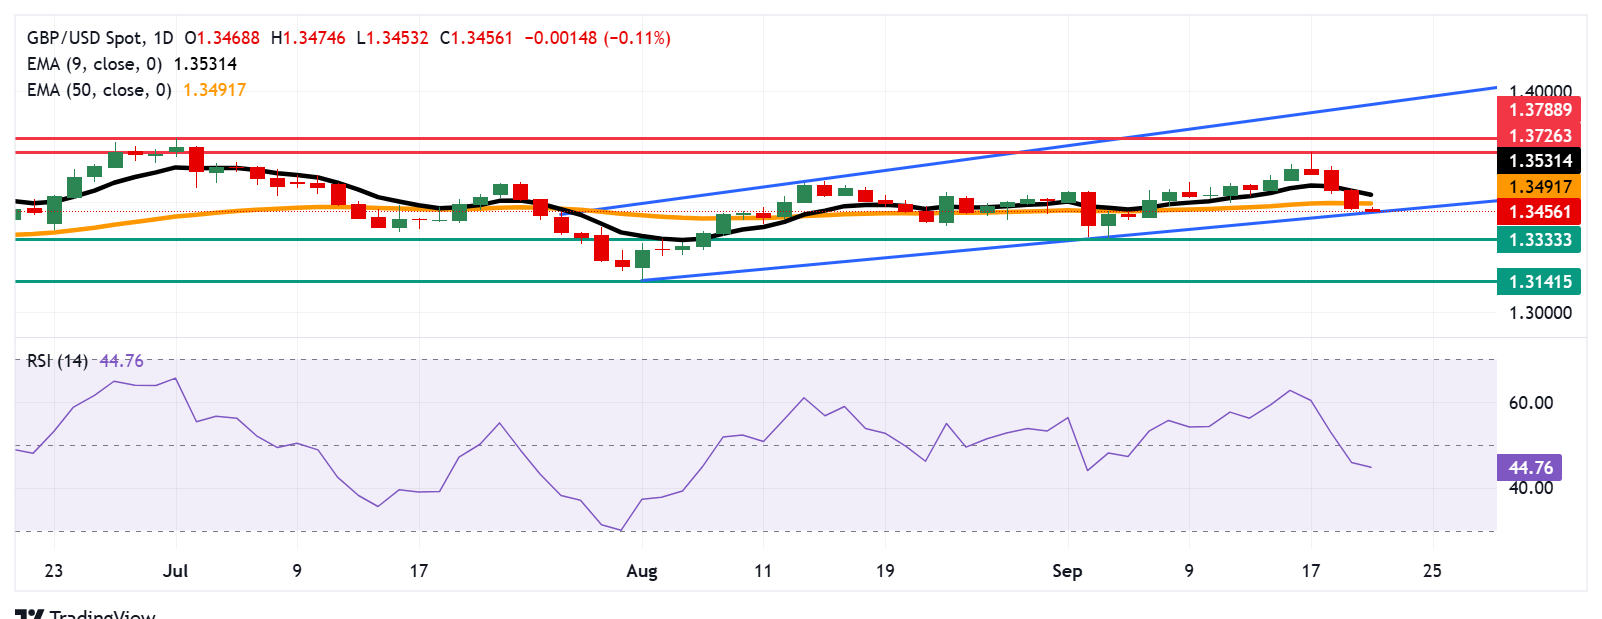
- The 14-day Relative Strength Index stays below 50, reinforcing the bearish bias.
- The immediate barrier appears at the 50-day EMA of 1.3491.
The GBP/USD pair continues its four-day losing streak, trading around 1.3460 during the Asian hours on Monday. The bearish shift appears as the daily chart’s technical analysis shows that the pair is on the verge of breaking below the ascending channel pattern.
However, the 14-day Relative Strength Index (RSI) remains below the 50 level, strengthening the bearish bias. Additionally, the GBP/USD pair is positioned below the nine-day Exponential Moving Average (EMA), suggesting the short-term price momentum is weaker.
The GBP/USD pair is testing its primary support at the ascending channel’s lower boundary around 1.3450. A break below the channel would confirm that the bearish bias is active and put downward pressure on the pair to test the monthly low at 1.3333, recorded on September 3, followed by the five-month low of 1.3141, which was reached on May 12.
On the upside, the GBP/USD pair may target the immediate barrier at the 50-day EMA of 1.3491, followed by the nine-day EMA at 1.3531. A break above these levels would improve the short- and medium-term price momentum and lead the pair to approach the two-month high of 1.3726, reached on September 17, followed by the 1.3788, the highest since October 2021, which was recorded on July 1.
GBP/USD: Daily Chart
Pound Sterling Price Today
The table below shows the percentage change of British Pound (GBP) against listed major currencies today. British Pound was the weakest against the US Dollar.
| USD | EUR | GBP | JPY | CAD | AUD | NZD | CHF | |
|---|---|---|---|---|---|---|---|---|
| USD | 0.15% | 0.10% | 0.27% | 0.13% | 0.10% | 0.17% | 0.34% | |
| EUR | -0.15% | -0.04% | 0.07% | -0.04% | -0.10% | -0.01% | 0.16% | |
| GBP | -0.10% | 0.04% | 0.06% | 0.02% | -0.03% | 0.05% | 0.25% | |
| JPY | -0.27% | -0.07% | -0.06% | -0.15% | -0.20% | -0.10% | 0.07% | |
| CAD | -0.13% | 0.04% | -0.02% | 0.15% | -0.05% | 0.04% | 0.22% | |
| AUD | -0.10% | 0.10% | 0.03% | 0.20% | 0.05% | 0.09% | 0.29% | |
| NZD | -0.17% | 0.01% | -0.05% | 0.10% | -0.04% | -0.09% | 0.16% | |
| CHF | -0.34% | -0.16% | -0.25% | -0.07% | -0.22% | -0.29% | -0.16% |
The heat map shows percentage changes of major currencies against each other. The base currency is picked from the left column, while the quote currency is picked from the top row. For example, if you pick the British Pound from the left column and move along the horizontal line to the US Dollar, the percentage change displayed in the box will represent GBP (base)/USD (quote).
Recommended Articles


Comments (0)
Click the $ button, enter the symbol, and select to link a stock, ETF, or other ticker.