

EUR/JPY Price Forecast: Marks fresh 14-month highs near 174.50

- EUR/JPY has reached a fresh 14-month high at 174.47 on Thursday.
- The 14-day Relative Strength Index remains above 50, indicating a persistent bullish bias.
- The crucial level of 173.00 could act as the primary support.
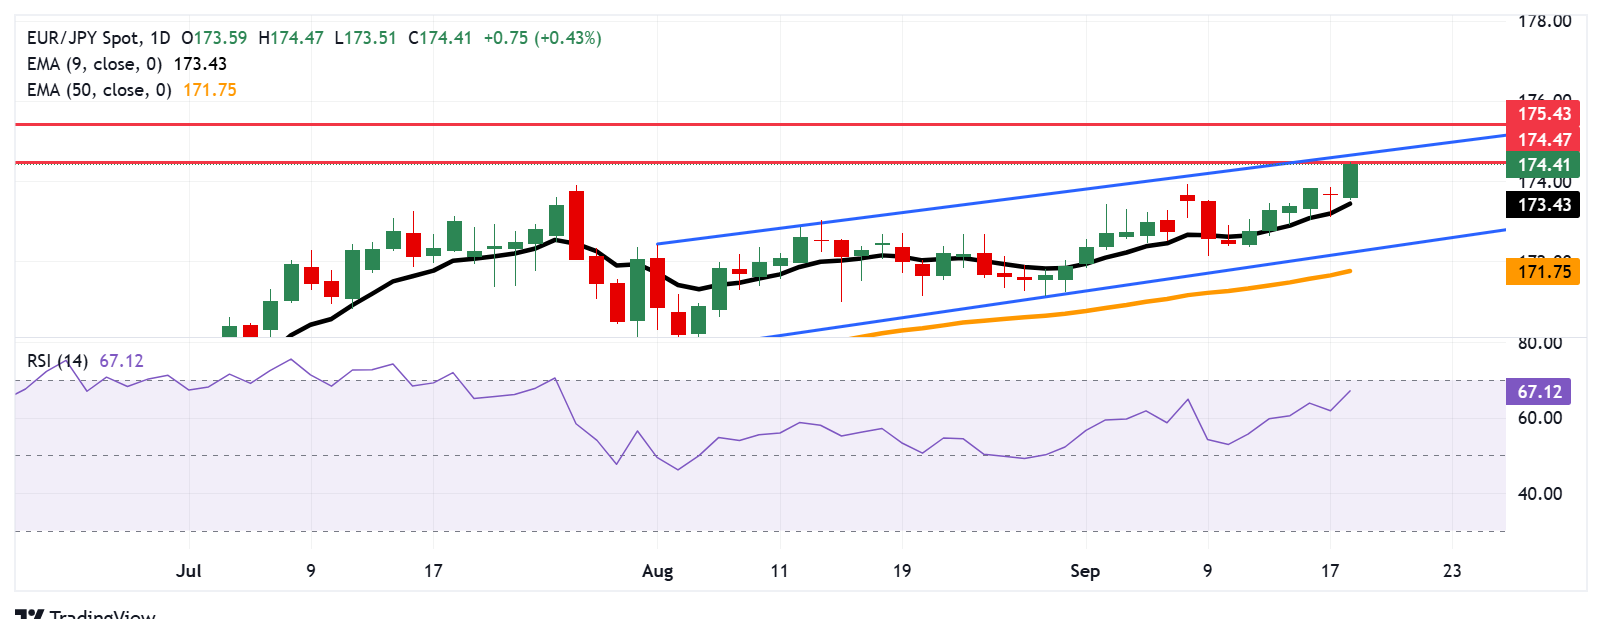
EUR/JPY advances more than a quarter of a percent, trading around 174.40 during the European hours on Thursday. The technical analysis of the daily chart indicates an ongoing bullish bias as the currency cross moves upwards within the ascending channel pattern.
The 14-day Relative Strength Index (RSI) is positioned above the 50 mark, strengthening the bullish bias. Additionally, the short-term price momentum is stronger as the EUR/JPY cross remains above the nine-day Exponential Moving Average (EMA).
The EUR/JPY cross has marked a fresh 14-month high at 174.47 on Thursday, which is aligned with the crucial level at 174.50. Further advance would target the upper boundary of the ascending channel around 174.70. A break above the channel would strengthen the bullish bias and support the currency cross to explore the region around the all-time high of 175.43, reached in July 2024.
On the downside, the initial support lies at the psychological level of 173.00, followed by the nine-day EMA of 173.43. A break below this level would weaken the short-term price momentum and prompt the EUR/JPY cross to navigate the region around the ascending channel’s lower boundary around 172.20, followed by the 50-day EMA at 171.75.
EUR/JPY: Daily Chart
Euro Price Today
The table below shows the percentage change of Euro (EUR) against listed major currencies today. Euro was the strongest against the New Zealand Dollar.
| USD | EUR | GBP | JPY | CAD | AUD | NZD | CHF | |
|---|---|---|---|---|---|---|---|---|
| USD | -0.13% | 0.03% | 0.29% | 0.05% | 0.24% | 1.14% | -0.00% | |
| EUR | 0.13% | 0.02% | 0.44% | 0.20% | 0.34% | 1.37% | 0.15% | |
| GBP | -0.03% | -0.02% | 0.40% | 0.17% | 0.31% | 1.27% | 0.12% | |
| JPY | -0.29% | -0.44% | -0.40% | -0.25% | -0.13% | 0.81% | -0.28% | |
| CAD | -0.05% | -0.20% | -0.17% | 0.25% | 0.17% | 1.23% | -0.05% | |
| AUD | -0.24% | -0.34% | -0.31% | 0.13% | -0.17% | 1.05% | -0.18% | |
| NZD | -1.14% | -1.37% | -1.27% | -0.81% | -1.23% | -1.05% | -1.11% | |
| CHF | 0.00% | -0.15% | -0.12% | 0.28% | 0.05% | 0.18% | 1.11% |
The heat map shows percentage changes of major currencies against each other. The base currency is picked from the left column, while the quote currency is picked from the top row. For example, if you pick the Euro from the left column and move along the horizontal line to the US Dollar, the percentage change displayed in the box will represent EUR (base)/USD (quote).
Recommended Articles


Comments (0)
Click the $ button, enter the symbol, and select to link a stock, ETF, or other ticker.