Ethereum Breaks 8-Year Resistance Against Bitcoin – Details

Ethereum has staged a strong performance over the past 24 hours, with its price rallying close to its previous all-time high. According to data from CoinGecko, ETH climbed as high as $4,837, just a touch below its 2021 peak of $4,878. The surge came after Federal Reserve Chair Jerome Powell’s speech at Jackson Hole, where he hinted that long-awaited rate cuts might be coming soon.
Interestingly, Ethereum is not only performing well against the dollar but also against Bitcoin, where technical analysis shows a long-awaited structural trendline appears to be breaking in Ethereum’s favor.
Analyst Calls Out ETH/BTC Breakout
According to a recent technical analysis, which was first revealed on the social media platform X by crypto analyst Ted Pillows, Ethereum is about to go on a massive performance against Bitcoin. Ted Pillows noted that the ETH/BTC breakout has finally happened after nearly eight years of repeated resistance rejections.
The analysis, which is based on the 2-week (2W) timeframe of the ETH/BTC pair, shows Ethereum’s price action breaking decisively above a long-term descending trendline that has held since 2017. At the time of the analysis, the ETH/BTC pair was trading around 0.04077 after a 7% price gain for Ethereum.
Interestingly, the chart shows how the ETH/BTC pair has been trying multiple times to break above this descending trendline with no success. The latest attempt, which has seen it approach the trendline again, kicked off in July 2025, and has been playing out for the past few weeks. The most recent 2-week candlestick has now seen the ETH/BTC peeking above the trendline.
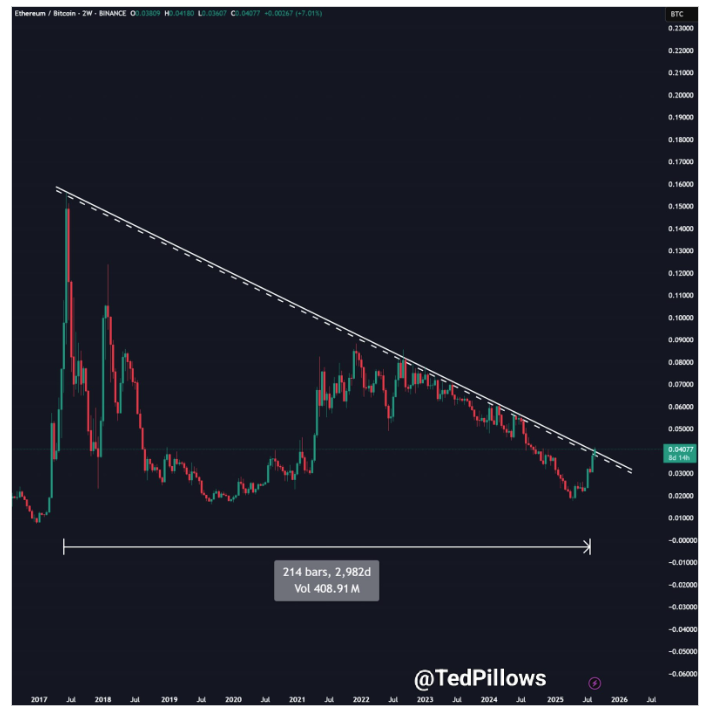
Chart Image From X: Ted Pillows
However, Pillows tempered his optimism with a caveat: “I just want a 2W confirmation above this level, and you’ll be surprised to see the Ethereum rally,” he said. This means confirmation is important in order for Ethereum to continue outperforming Bitcoin. The breakout will be validated once the 2-week candle closes above resistance, and this might then turn the former downtrend into a base of support on the ETH/BTC pair.
$5,400 Bull Flag Target
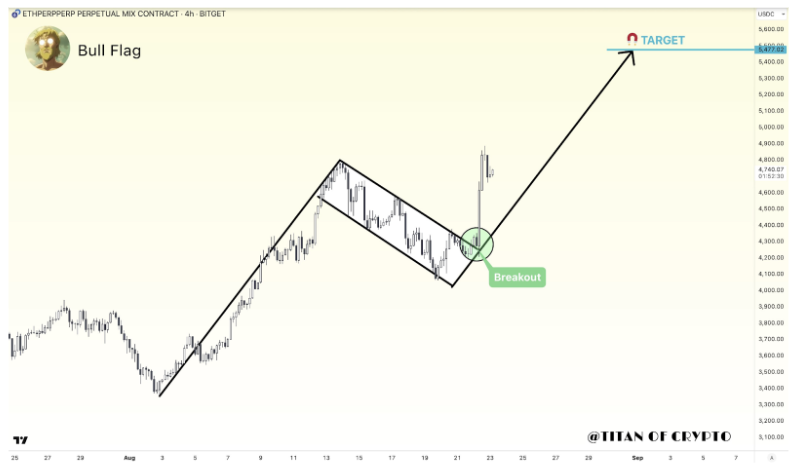
Another analyst, Titan of Crypto, noted a bullish setup on the shorter-term 4-hour ETH/USD chart. Technical analysis of the 4-hour candlestick timeframe chart shows Ethereum is currently breaking out of a well-defined bull flag formation, which is a continuation pattern that typically appears in the middle of a trend.
The breakout, already underway, kicked off when Ethereum broke above $4,200 in August. The analyst predicted a price target around $5,400 to $5,477, which means Ethereum could not only retest but also break above its all-time high and enter into new price territories above $5,000.
At the time of writing, Ethereum was trading at $4,748.
Featured image from Unsplash, chart from TradingView
Recommended Articles