

Bitcoin Rally Weakens—Is a Price Correction Coming?

TradingKey – Bitcoin's recent surge appears to be slowing down, with technical indicator RSI signaling overbought conditions, suggesting an imminent correction.
On Friday, May 23, Bitcoin (BTC) hovered around the $110,000 mark, showing signs of bullish exhaustion. As of publication, Bitcoin dipped slightly to $110,400.
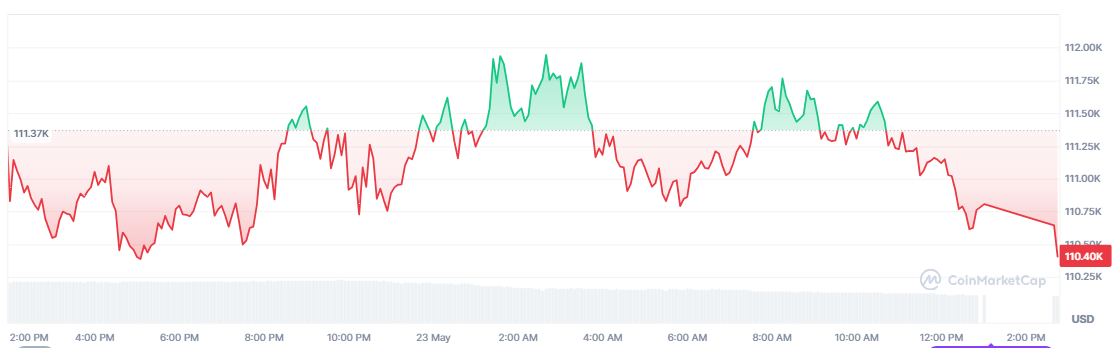
Bitcoin Price Chart – Source: CoinMarketCap.
Recent Trade Policy Boosted Bitcoin’s Run
On April 9, former U.S. President Donald Trump announced a 90-day tariff suspension, triggering BTC’s rebound from a low of $75,000.
- Subsequent trade agreements between the U.S., UK, and China further reduced tariffs, fueling Bitcoin’s continued upward trajectory.
- To date, Bitcoin has surged 48%, reaching a new all-time high of $112,000.

Bitcoin Price Trend – Source: TradingView.
RSI Signals Overbought—Potential Pullback Ahead
Bitcoin’s Relative Strength Index (RSI) currently stands at 74, indicating overbought conditions that could lead to a consolidation phase.
- A retracement to $105,000 may occur before BTC regains upward momentum.
- In an extreme scenario, BTC could test the $100,000 support level before another rally.
Recommended Articles


Comments (0)
Click the $ button, enter the symbol, and select to link a stock, ETF, or other ticker.