

Gold hits three-week low as USD steadies and Russia-Ukraine peace hopes rise

- Gold price continues to lose ground on Wednesday amid some follow-through USD buying.
- Diminishing odds for a jumbo Fed rate cut boost the USD and weigh on the precious metal.
- Hopes for a Russia-Ukraine deal further drive flows away from the safe-haven commodity.
Gold (XAU/USD) hits a nearly three-week low during the Asian session on Wednesday, with the bears now awaiting a sustained break below the 100-day Simple Moving Average (SMA) before positioning for further losses. The US Dollar (USD) is seen prolonging its steady uptrend for the third straight day amid diminishing odds for a more aggressive policy easing by the Federal Reserve (Fed). This, in turn, is seen as a key factor undermining the non-yielding bullion.
Apart from this, hopes for a Russia-Ukraine peace deal exert additional downward pressure on the safe-haven Gold. Moving ahead, investors now look to the release of the FOMC meeting Minutes. Furthermore, Fed Chair Jerome Powell's speech at the Jackson Hole Symposium could offer fresh cues about the central bank's policy outlook. This will play a key role in driving the USD demand in the near term and determining the next leg of a directional move for the commodity.
Daily Digest Market Movers: Gold bears have the upper hand amid firmer USD; hopes for Russia-Ukraine peace deal
- Traders continue to price out the possibility of a jumbo interest rate cut by the Federal Reserve in September, pushing the US Dollar to its highest level in more than a week and dragging the Gold price to a three-week low on Wednesday. This follows last Thursday's release of hotter US Producer Price Index, which rose in July at the fastest monthly pace since 2022 and indicated a gain of momentum in price pressures.
- Diplomatic efforts to end the protracted Russia-Ukraine war picked up pace this week and further seem to undermine the safe-haven bullion. In fact, White House press secretary Karoline Leavitt said on Tuesday that plans for a bilateral meeting between Russian President Vladimir Putin and Ukrainian President Volodymyr Zelensky are underway. Earlier, US President Donald Trump hosted Zelenskyy, the EU, and UK leaders for talks.
- Zelenskiy described the summit as a "major step forward" towards ending Europe's deadliest conflict in 80 years and praised the White House for setting up a trilateral meeting with Putin and Trump. Meanwhile, Trump ruled out deploying ground troops to Ukraine but suggested air support could be part of a deal to end the war in the region. Russia, on the other hand, launched 270 drones and 10 missiles at Ukraine.
- Minutes of the Fed's July policy meeting will be released later today. This, along with Fed Chair Jerome Powell's speech at the Jackson Hole Symposium, could offer more insights into the central bank's policy stance. According to the CME Group's FedWatch Tool, traders are pricing in a greater chance that the Fed will start its rate-cutting cycle in September and lower borrowing costs by 25 basis points twice by the year-end.
- Meanwhile, Trump once again criticized Powell on Tuesday for being too late in cutting rates and demanded that the Fed lower borrowing costs immediately. Trump claimed that Powell’s unwillingness to cut rates now stood to hurt the housing market. Powell, however, has remained largely non-committed towards any future rate cuts despite increasing political pressure from the Trump administration.
Gold could retest range support once pivotal 100-day SMA is broken
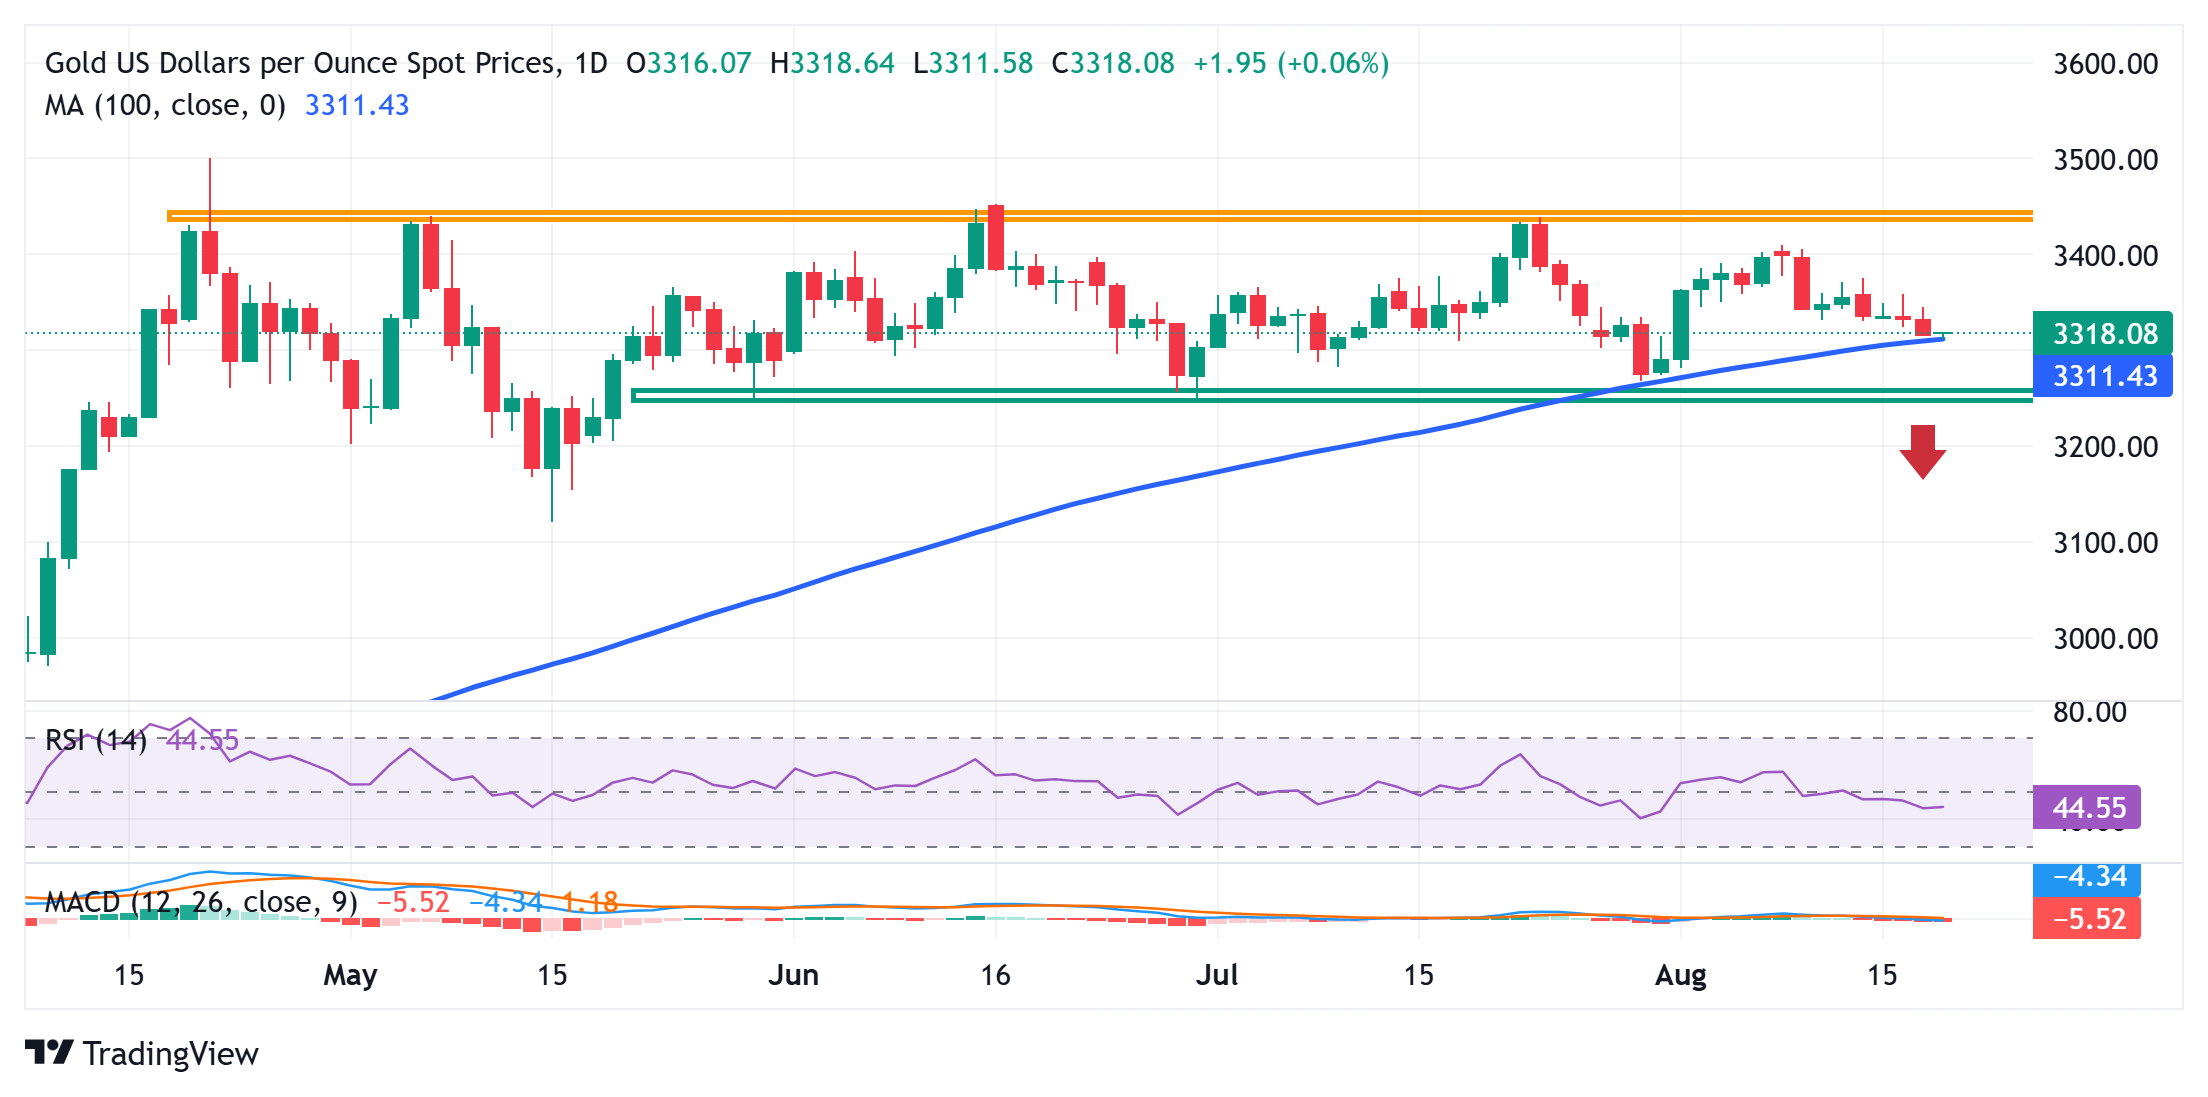
A further slide below the 100-day SMA for the first time since December 2024 will be seen as a fresh trigger for the XAU/USD bears. Given that oscillators on the daily chart have just started gaining negative traction, the Gold price might then accelerate the fall below the $3,300 mark and test the $3,270-3,265 strong horizontal support. The latter represents the lower boundary of a three-month-old trading range and should act as a key pivotal point. A convincing break below will suggest that the commodity has topped out and pave the way for a further near-term depreciating move.
On the flip side, any attempted recovery might now confront an immediate hurdle near the $3,335 region. This is followed by the weekly peak, around the $3,358 zone, which, if cleared, might trigger a short-covering rally and lift the Gold price to the $3,375 intermediate hurdle en route to the $3,400 mark. Some follow-through buying would set the stage for an extension of the momentum towards challenging the $3,434-3,435 heavy supply zone, also marking the top boundary of a multi-month-old trading range.
US Dollar PRICE This week
The table below shows the percentage change of US Dollar (USD) against listed major currencies this week. US Dollar was the strongest against the New Zealand Dollar.
The heat map shows percentage changes of major currencies against each other. The base currency is picked from the left column, while the quote currency is picked from the top row. For example, if you pick the US Dollar from the left column and move along the horizontal line to the Japanese Yen, the percentage change displayed in the box will represent USD (base)/JPY (quote).
Recommended Articles


Comments (0)
Click the $ button, enter the symbol, and select to link a stock, ETF, or other ticker.