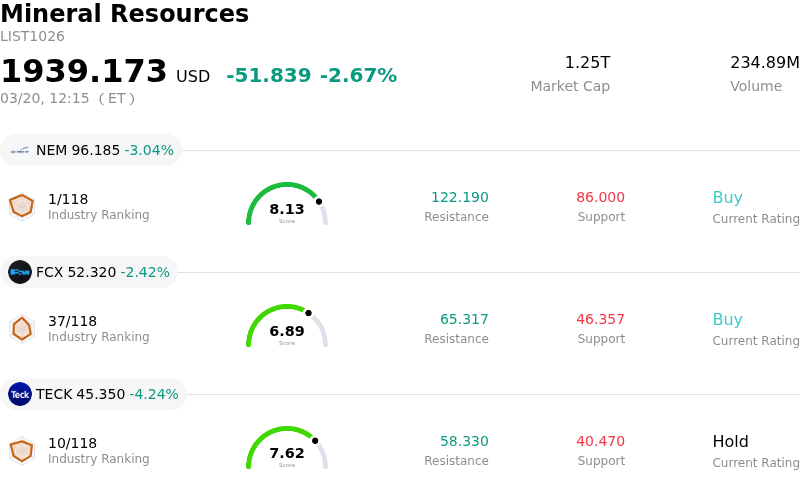
Newmont Corporation Stock (NEM) Moved Down by 3.04% on Mar 20: Facts Behind the Movement

Newmont Corporation (NEM) moved down by 3.04%. The Mineral Resources sector is down by 2.67%. The company underperformed the industry. Top 3 stocks by turnover in the sector: Newmont Corporation (NEM) down 3.04%; Freeport-McMoRan Inc (FCX) down 2.42%; Teck Resources Ltd (TECK) down 4.24%.
What is driving Newmont Corporation (NEM)’s stock price down today?
Newmont Corporation (NEM) experienced a significant downward movement today, primarily driven by a broader decline in gold prices and specific company-related concerns. The price of gold has eased from its recent highs, as markets have begun to reassess the trajectory of US interest rates.
The prevailing "higher-for-longer" interest rate narrative is gaining traction, stemming from stronger-than-expected US economic data, including inflation figures, and a resilient labor market. This shift in outlook has led market participants to scale back earlier expectations for multiple Federal Reserve rate cuts in 2026. Higher interest rates tend to increase the opportunity cost of holding non-yielding assets like gold, making it less attractive to investors. A strengthening US dollar further pressures gold prices, as the commodity becomes more expensive for international buyers.
Adding to Newmont's specific challenges, investors are re-evaluating the company's 2026 guidance. This guidance points to anticipated lower attributable gold volumes compared to the previous year and higher all-in sustaining costs. This outlook suggests potential pressure on future earnings and cash flow, especially if gold prices do not rebound. Recent insider selling activity has also contributed to negative sentiment surrounding the stock. While many analysts maintain favorable ratings for Newmont, some have recently adjusted their price objectives downwards. The broader mining sector has also been sensitive to rising fuel and operating costs, which can compress margins.
Technical Analysis of Newmont Corporation (NEM)
Technically, Newmont Corporation (NEM) shows a MACD (12,26,9) value of [-1.36], indicating a sell signal. The RSI at 29.23 suggests sell condition and the Williams %R at -90.58 suggests oversold condition. Please monitor closely.
Fundamental Analysis of Newmont Corporation (NEM)
Newmont Corporation (NEM) is in the Mineral Resources industry. Its latest annual revenue is $22.67B, ranking 8 in the industry. The net profit is $7.08B, ranking 3 in the industry. Company Profile
Over the past month, multiple analysts have rated the company as Buy, with an average price target of $137.03, a high of $177.00, and a low of $64.32.
More details about Newmont Corporation (NEM)
Company Specific Risks:
- Current declines in gold prices are directly impacting Newmont's share performance and revenue outlook, leading to significant intraday volatility.
- Newmont projects a nearly 10% decrease in attributable gold production for 2026, signaling a "trough" year due to planned mine sequencing.
- The company anticipates a significant increase in all-in sustaining costs (AISC) to $1680 per ounce for 2026, primarily due to higher royalties and taxes, which will compress profit margins.
- A notice of default related to the Nevada Gold Mines joint venture with Barrick Gold has introduced uncertainty regarding a meaningful portion of Newmont's future output.