AbbVie Inc Stock (ABBV) Moved Down by 4.60% on Mar 18: A Full Analysis

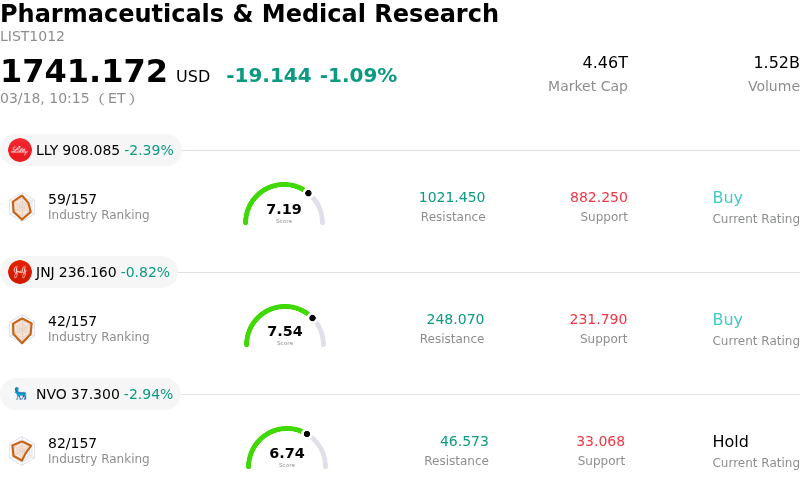
AbbVie Inc (ABBV) moved down by 4.60%. The Pharmaceuticals & Medical Research sector is down by 1.09%. The company underperformed the industry. Top 3 stocks by turnover in the sector: Eli Lilly and Co (LLY) down 2.39%; Johnson & Johnson (JNJ) down 0.82%; Novo Nordisk A/S (NVO) down 2.94%.
What is driving AbbVie Inc (ABBV)’s stock price down today?
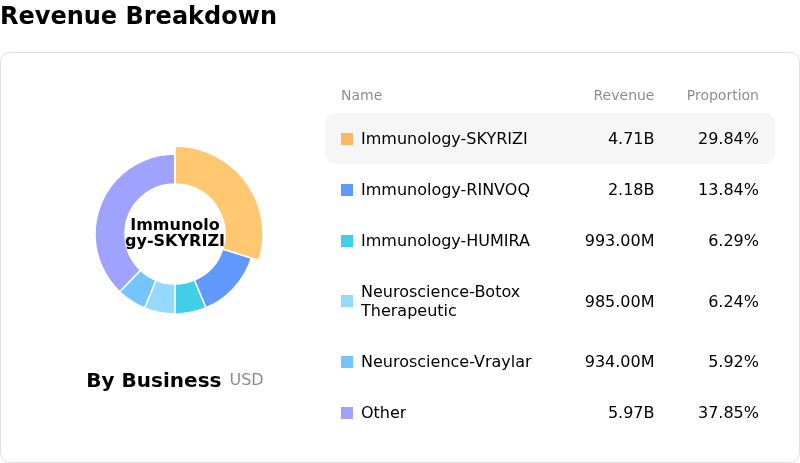
The downward movement in AbbVie's stock can be attributed to several factors, with ongoing pressure from biosimilar competition for Humira and persistent softness in the company's aesthetics business appearing to be key contributors. Sales of Humira are anticipated to continue their decline throughout 2026 as more healthcare plans integrate biosimilars into their formularies, while the aesthetics division is contending with broader macroeconomic headwinds and tempered consumer sentiment.
Adding to the negative sentiment were recent insider transactions. A notable divestiture of shares by an Executive Vice President occurred in late February, followed by another significant sale by a Senior Vice President in early March. Such executive selling activity can be interpreted by investors as a potential indicator of diminished confidence in the company's near-term outlook.
Moreover, technical indicators around mid-March suggested an intermediate correction for the stock, as it fell below its 50-day simple moving average. Earlier in the month, technical analysis also pointed to overbought conditions and a weakening trend momentum, hinting at a possible near-term reversal or period of consolidation. While the company had announced positive topline results from a Phase 1 study for an obesity treatment candidate and engaged in a promising collaboration for an antibody discovery platform, these positive developments did not appear to counteract the prevailing negative pressures on the current trading day.
Technical Analysis of AbbVie Inc (ABBV)
Technically, AbbVie Inc (ABBV) shows a MACD (12,26,9) value of [0.69], indicating a neutral signal. The RSI at 40.40 suggests neutral condition and the Williams %R at -98.19 suggests oversold condition. Please monitor closely.
Fundamental Analysis of AbbVie Inc (ABBV)
AbbVie Inc (ABBV) is in the Pharmaceuticals & Medical Research industry. Its latest annual revenue is $61.16B, ranking 7 in the industry. The net profit is $4.19B, ranking 14 in the industry. Company Profile
Over the past month, multiple analysts have rated the company as Buy, with an average price target of $251.44, a high of $328.00, and a low of $187.88.
More details about AbbVie Inc (ABBV)
Company Specific Risks:
- AbbVie faces potential pressure on its dividend coverage, with a projected Dividend Cushion Ratio (DCR) of 2.19x for 2026, primarily due to ongoing capital expenditure plans.
- Recent SEC filings, dated March 6 and March 11, reveal multiple executive open-market sales and tax-related share dispositions, including one Executive Vice President conducting open-market sales of 18,668 shares on March 2, 2026.
- Despite generally positive overall earnings, the company continues to experience revenue declines across specific business lines, indicating underlying weaknesses within its portfolio.