


DEX-to-CEX Spot Volume Ratio Hits Record 24.16% in July



Decentralized exchanges have been chipping away at the volume from centralized platforms for a while now and ever since April of last year, this ratio has consistently been in the double digits territory. Last month, onchain trading took its largest bite out of CEX volume. According to the Block’s DEX to CEX spot trade volume, the ratio printed 24.16% for July, the highest reading since the series began in January 2019.
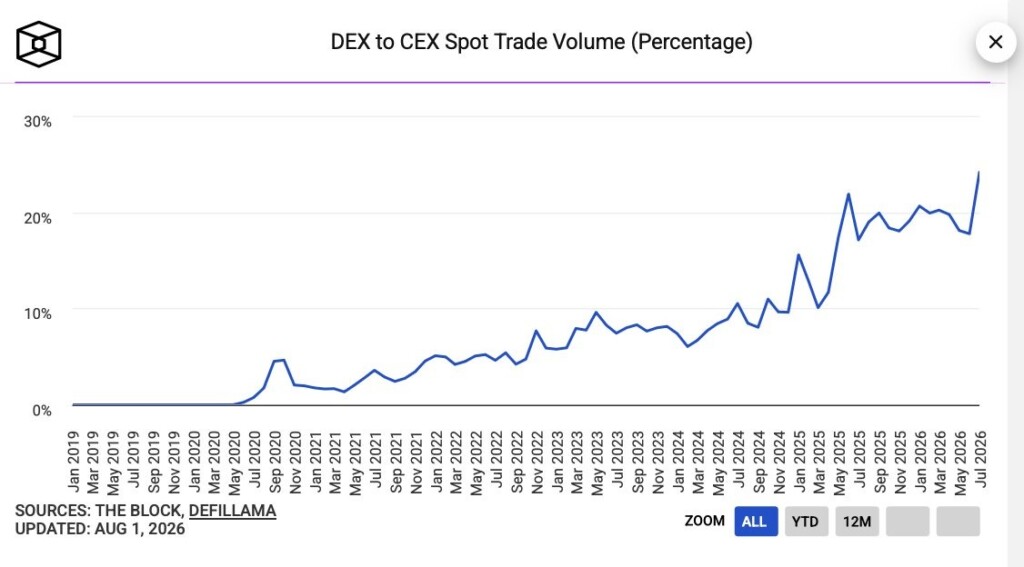
Source: The Block
At first glance, the ratio looks like a win for decentralized exchanges but the volume data underneath this actually tells a different story.
Both Sides of the Market Shrank. One Shrank Faster
Spot DEX volume actually fell to 124.82 billion in the month of July, down 6% from the previous month. In fact, this was the weakest month for onchain trading since September 2024. Spot volumes on centralized exchanges came in worse. Data from Artemis shows that Tier-1 centralized exchange monthly spot volume saw $375 billion last month, the lowest monthly total since October 2023. In this sense, the ratio hit a new high because centralized spot volume shrank faster.
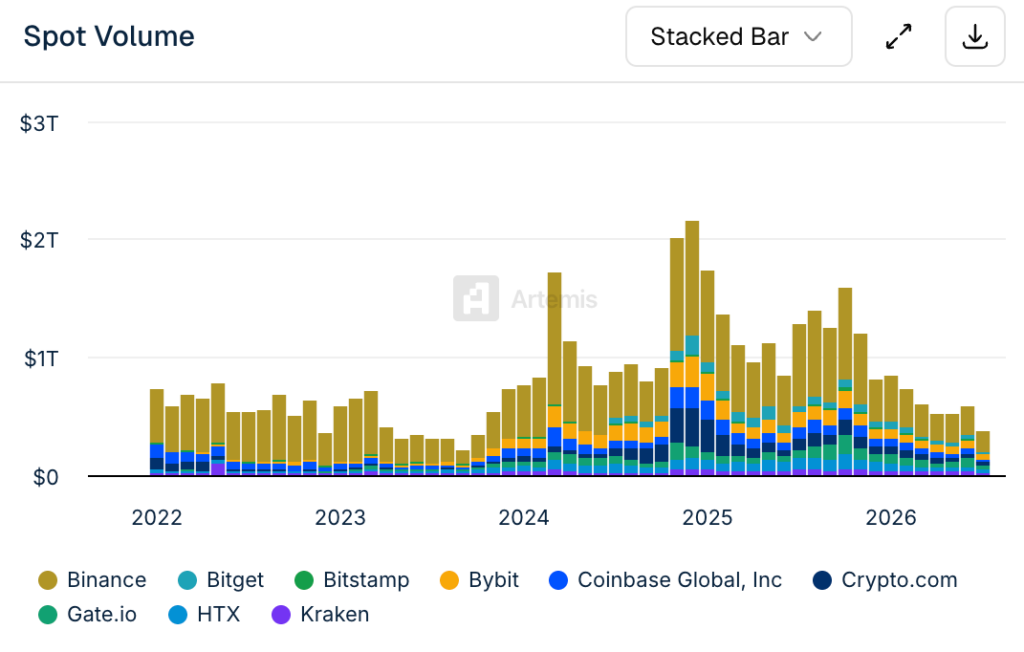
Source: Artemis
Traders stopped trading. Onchain platforms held on to slightly more of a smaller pool than centralized ones did. Summer volume droughts are not out of the ordinary in crypto. What changed is which side of the market wears them worse.
The 24.16% Reading is a Ratio, Not a Market Share
The Block divides monthly DEX volume by volume from a filtered basket of major centralized exchanges with reliable reporting, and flash trades get stripped out before the calculation runs. Venues outside that basket never enter the denominator.
A quarter of global spot crypto trading did not settle onchain in July. Onchain volume equalled about a quarter of what the vetted centralized venues cleared. The series is useful for tracking direction across months. It is not a market share figure and should not be quoted as one.
Execution Quality Closed a Gap That Used to Be Obvious
The ratio has been climbing for reasons that have nothing to do with July. Aggregators now routinely match or beat centralized pricing on spot pairs up to a few million dollars in notional. That was not true two years ago, when slippage was the main argument for keeping size on order books.
Listing speed does the rest. New assets trade onchain from the first block and reach centralized venues weeks later, if at all. Traders chasing early access have no centralized alternative to pick. Robinhood Chain contributed fresh July activity in that category, capturing flow that had nowhere else to go.
None of it explains a record set during the quietest month in nearly two years. It does explain why the floor under the ratio keeps rising.
The Test Arrives With the Next Risk-On Month
The real test comes when retail floods back in and there is a noticeable uptick in liquidity across the space. If the ratio holds during such a scenario, this will point to a more genuine migration in traders from centralized platforms to decentralized ones.
The smartest crypto minds already read our newsletter. Want in? Join them.










コメント (0)
$ボタンをクリックし、シンボルを入力して、株式、ETF、またはその他のティッカーシンボルをリンクします。