

Behind the Record Gold Exports, a Signal Most People Missed


AI Podcast
US gold exports surged in early 2026, driven by a widening EFP spread in late 2024. This spread, reflecting a differential between London spot and New York futures, was caused by institutional hedging against potential tariffs on physical gold imports. This led to a massive inflow of gold into COMEX, temporarily distorting the Atlanta Fed's GDPNow model. Upon the announcement of a gold tariff exemption in April 2025, the EFP compressed, and gold began flowing out of the US. These commodity flows, rather than price alone, signal underlying market anxieties.

In early 2026, for three consecutive months, the top item on America's export list was not semiconductors, not Boeing aircraft, not oil, not soybeans — it was gold.
In February 2026 alone, US gold exports reached $17.88 billion, a historic record, accounting for the largest share of that month's total export growth and pulling overall US exports to an all-time high of $314.8 billion. More than 85% of that gold departed from New York's JFK Airport, and for the first time, Hong Kong overtook the UK to become the second-largest buyer.
Financial media offered much the same explanation: strong safe-haven demand, gold prices at record highs, everyone selling gold.
That wasn't wrong. But it was only the final frame of the story.
The real story begins more than a year earlier. Gold prices weren't nearly as high back then, but a little-known number was already quietly speaking — pricing in what was about to happen months before any news headline. That number is called the EFP. Most investors have never heard of it.
Yet it was the EFP that triggered a cross-Atlantic gold migration worth over a hundred billion dollars, and along the way caused the US government's official GDP forecasting model to spit out a fake recession signal of negative 2.8%, forcing the Atlanta Fed to rewrite its model's core logic.
Walk through this from the beginning, and you'll find that understanding the gold market doesn't require staring at prices — it requires watching the signal that speaks before prices do.
Two Cities, One Strange Spread
The global gold market has two major centers: one in New York, one in London.
New York's COMEX is a futures exchange. The real-time gold price you see on any financial app is essentially the near-month contract price quoted here. London's LBMA is an over-the-counter market — the world's largest for gold trading — with daily turnover across gold, silver, platinum and palladium running into the hundreds of billions of dollars. Trading here is done in physical gold, in standard units of 400-troy-ounce bars, roughly 12 kilograms each.
Under normal conditions, prices in these two markets track each other closely. The gap between London spot and New York futures is typically just ten to twenty dollars, reflecting freight, storage and financing costs. This gap is called the EFP. Ordinary investors never look at it, because in calm times it's a boring cost parameter that barely moves.
Late 2024, it suddenly started surging.
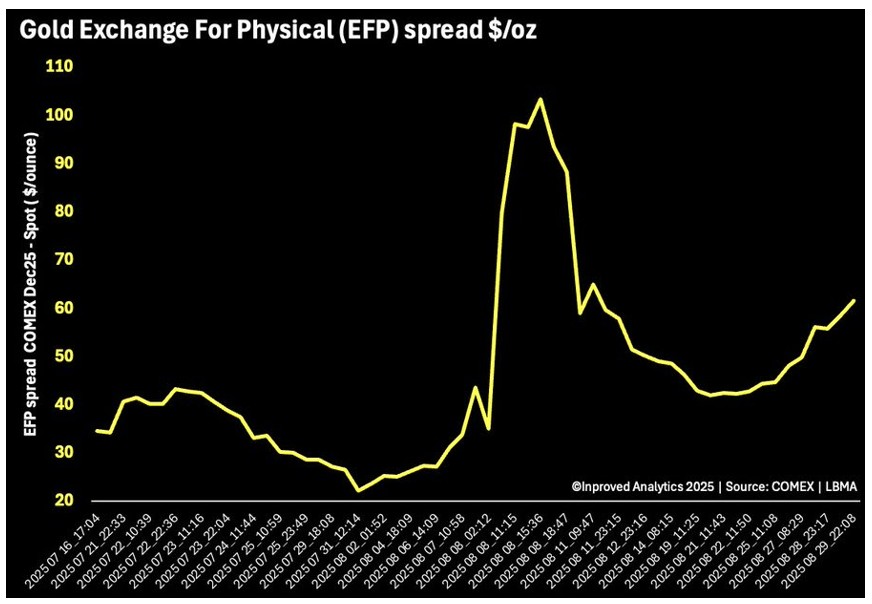
Source: InProved
Ten dollars became forty, forty became fifty, and by mid-January 2025 it had broken through sixty dollars. That meant: the same ounce of gold was worth sixty dollars more sitting in New York than sitting in London.
Gold's Widening Fault Lines: Shanghai Inflows and EFP Spreads Point to a Market on Edge
In the world's most liquid precious metals market, a gap like that shouldn't last. Arbitrage would normally close it — someone buys in London, sells in New York, and the spread compresses. But it didn't close. That meant whatever was holding it open was faster and larger than the arbitrageurs.
What was that force?
What Is a "What If" Worth?
To answer that, you need to understand how major banks and dealers operate in the gold market.
Their standard approach: hold physical gold in London, simultaneously short an equivalent amount of gold futures in New York, hedge both sides, and collect the spread and service fees in between. A stable business, with one prerequisite: that prices in both locations ultimately converge at delivery. Close both positions at expiry, the two sides cancel out, done.
Late 2024, that prerequisite started to wobble.
Trump was coming back. In his first term, tariffs shifted constantly — escalating or easing with each round of negotiations, lines never clearly drawn. This time, the market consensus was that it would be bigger. But which product categories would be targeted? Nobody knew.
Gold has historically never been a tariff target. It's a financial asset, not a consumer good. Rationally, the probability was near zero.
But bank risk management departments don't run probability exercises. They run stress tests: not "will this happen?" but "if it does, how bad is the damage?"
The answer was uncomfortable. If gold were hit with tariffs, physical gold imported into the US would carry an added tax burden. But the short futures positions they held in New York could result in physical delivery demands from counterparties — meaning they'd need to hold compliant physical gold on US soil. At that point, gold inside the US and gold in London would no longer be the same price. Their hedge would go from "essentially flat" to "carrying an unbridgeable tax gap" — the size of the gap equal to the tariff rate times their position.
Even at 5% probability, that potential gap was unacceptable.
So they acted: covered the New York short positions, and arranged to move physical gold into the US. As shorts were covered, New York futures prices rose; as physical gold flooded in, London spot supply tightened. Both forces together blew the EFP wide open.
Once the EFP opened, global arbitrageurs piled in — buying spot in London, selling futures in New York, locking in the spread. But execution wasn't simple: London's 400-oz bars don't meet COMEX delivery specifications. They had to be routed through Swiss refineries, melted down and recast into 100-oz bars, then loaded onto planes and flown to vaults near JFK Airport.
Not a metaphor. Bloomberg reported it directly at the time: Swiss refineries were flying gold bars to the US every single day.
Swiss customs data confirmed it: in January 2025, Switzerland's gold exports to the US hit a thirteen-year high. COMEX gold inventory surged from roughly 17.1 million troy ounces around the time of Trump's election in November 2024 to a peak of 43.3 million troy ounces in March 2025 — a 153% increase in four months, the largest single-quarter inflow on record. Net new inflows were roughly 26.2 million ounces, equivalent to about 815 tonnes and approximately $80+ billion; the peak inventory total was worth roughly $135 billion, equivalent to about 40% of Germany's official gold reserves.
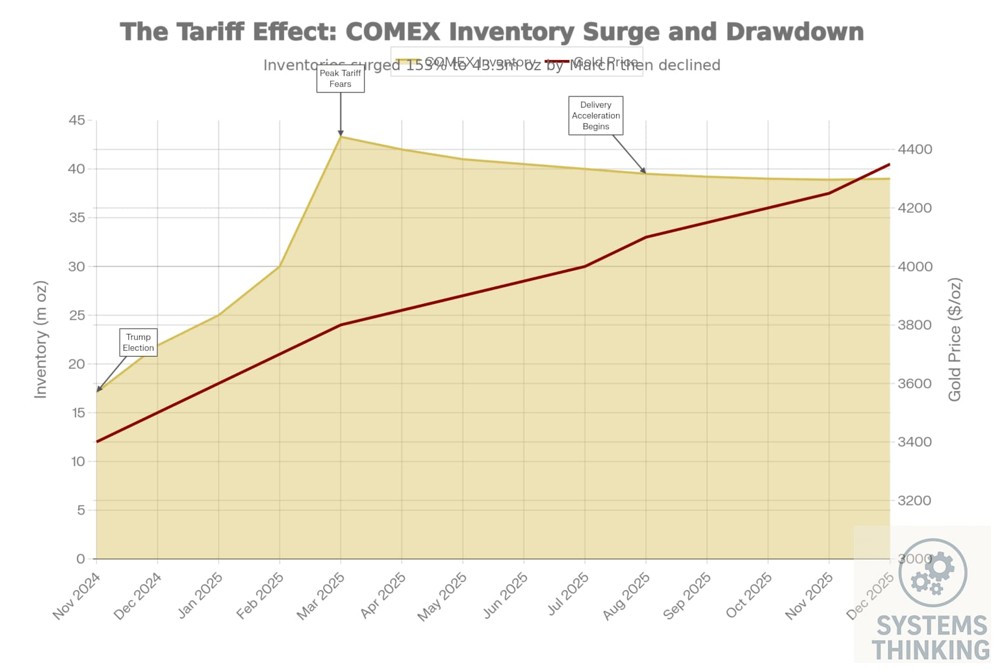
Source: Market Architect Capital Research
The starting point for all of this: five words — "tariffs might hit gold." A low-probability worry drove over a hundred billion dollars of physical assets across the Atlantic.
How a GDP Model Invented a Fake Recession
The scale of this migration was large enough to hit something that had nothing to do with gold: the Atlanta Fed's GDPNow model.
GDPNow is one of the most closely watched economic nowcasting tools in the Federal Reserve system, updating its estimate of current-quarter GDP growth daily based on the latest high-frequency data. Major banks and financial media cite it constantly. In early 2025, it produced a number that shocked markets: the forecast for US Q1 GDP growth dropped from around +3.9% at the start of the year to negative 2.8% — in just over two months.
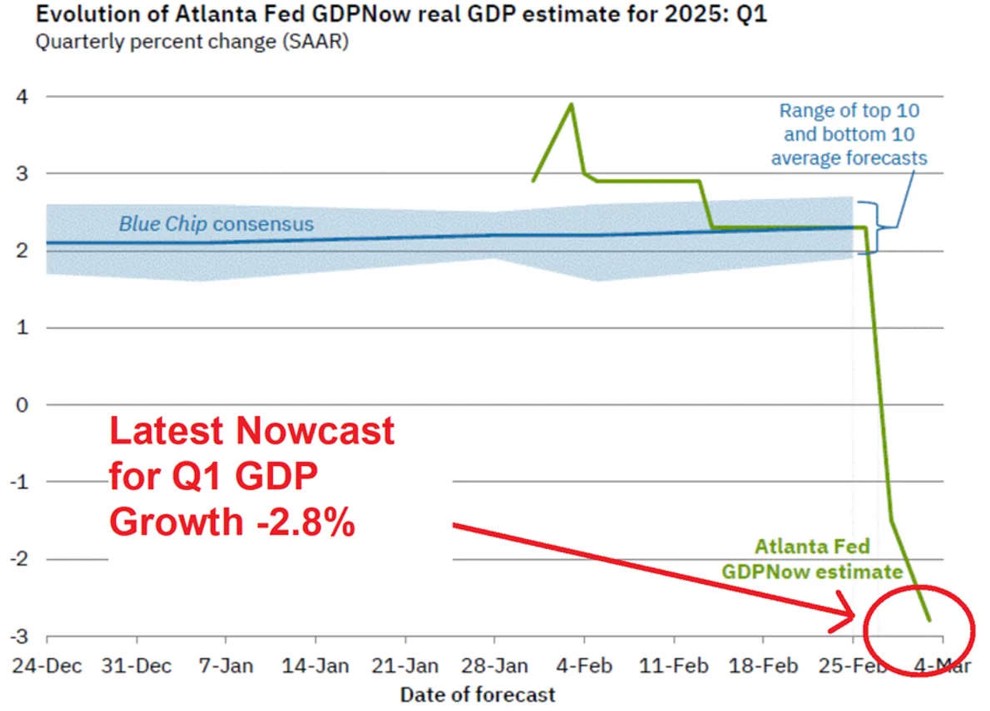
Source: Kos Media
Atlanta Fed model forecasts nearly -3% recession in Q1 | Misc. - Blind
Negative 2.8%. Enough to trigger widespread recession fears, though it fell short of the deepest quarterly drops seen during the 2008 financial crisis. "Recession Is Here" headlines proliferated. Markets swung sharply.
But nearly all of that negative reading came from one source: a surge in gold imports.
In the GDP accounting framework, imports are a subtraction. GDPNow's designers had never built special handling for gold imports, because historically that figure ran only $1–4 billion per month — small enough to ignore. But in January 2025, non-monetary gold imports suddenly jumped to roughly $32.6 billion, followed by roughly $23 billion in February. The model treated those gold bars stacking up in New York vaults as a collapse in consumer spending, annualized the figure, and produced that alarming number.
In reality, the BEA's advance estimate showed Q1 2025 US real GDP contracted at an annualized rate of 0.3%; the third estimate put the decline at 0.5%. Either way, far better than the -2.8% GDPNow had signaled. Most of that gap was statistical distortion from gold logistics, not genuine economic contraction.
The Atlanta Fed later published an explanation and revised GDPNow's methodology in April 2025, stripping non-monetary gold flows out of the GDP calculation. For the first time in the model's history, the abnormal movement of a single commodity forced a rewrite of its foundational logic.
A policy risk that never materialized caused the most authoritative economic forecasting model in the US to flash a false recession signal, and sent global financial media into wall-to-wall recession coverage. All of it traced back to a rumor with no official document behind it.
The Tariff Exemption Came, and Gold Flew Home
On April 2, 2025, the Trump administration announced a sweeping reciprocal tariff package. The exemption list explicitly stated: gold and precious metals are not subject to tariffs.
That single line pulled the foundation out from under the entire chain of logic.
The next day, the EFP compressed from above $60 to around $20. A Swiss refinery executive later told reporters: "The urgency to ship gold to New York — it disappeared almost overnight once the exemption was announced."
Swiss customs data confirmed the timing: Switzerland's gold exports to the US dropped from 103.3 tonnes in March to 12.7 tonnes in April; at the same time, Swiss gold imports from the US rose from 25.5 tonnes to 63.0 tonnes, as the gold that had poured into New York began flowing back into European refining and trading networks.
The gold that had been pushed into the US by tariff panic was now moving back out in similar volumes. Record imports coming in, record exports going out. The gold had simply made an unplanned transatlantic stopover — caused by a tariff that never happened.
But by early 2026, US gold exports were hitting records again, three months running — a sign that the underlying logic hadn't ended. It had simply moved into its next chapter.
Prices Spoke Before the News Did
Look at the timeline: the EFP started widening in late 2024; the tariff exemption was officially announced on April 2, 2025. Four months in between.
During those four months, no policy document said a word. But that 60-dollar EFP spread had already put a price on a risk that was never officially confirmed. Every trade that pushed the EFP higher was essentially asking: if tariffs come, how much do I need to cover the cost? The answer was sixty dollars.
This is a feature of financial markets that gets proven over and over but rarely registers with ordinary investors: price moves always happen before policy announcements.
The EFP is a niche metric, but similar "should-be-equal prices that suddenly diverge" spreads exist in every market. In rates markets, widening basis swaps between Treasuries and interest rate swaps are an early warning of liquidity stress. In credit markets, a sudden blowout in investment-grade versus high-yield spreads signals tightening credit conditions. In FX markets, onshore-offshore rate differentials are the most sensitive gauge of capital control expectations. In equity markets, the premium between A-shares and H-shares of the same company is a real-time measure of cross-market sentiment divergence.
These spreads are how markets translate wordless anxiety into numbers. They don't need official confirmation. They just need real money placing bets.
People reading the news are explaining what already happened. People reading spreads are tracking what markets are worried about right now. Between those two, there's often a gap of several months.
The Same Price Move Can Mean Two Completely Different Things
Most people look at gold through one lens: price. Up is good, down is bad. That's not wrong — but it's an incomplete map.
This story points to another dimension: flow. Where is gold moving? Who is behind it? Is this flow temporary or structural?
When gold surged from London to New York, the driver was tariff arbitrage — a temporary price distortion created by policy uncertainty. Once the arbitrage ended, the flow reversed and prices pulled back. Temporary.
When gold flowed from New York toward Asia and the Middle East, the picture became more complicated. Part of it was arbitrage funds returning to base. But another part was fundamentally different buyers taking delivery. Chinese and Middle Eastern private physical gold demand was quietly rising throughout this period. They weren't arbitraging — they were allocating. A long-term bet against confidence in the dollar system, the kind of asset restructuring that central banks and sovereign wealth funds do when de-dollarization is accelerating. That demand doesn't disappear just because the EFP normalizes.
The same "record export figures" contained two entirely different types of capital flows. One was going to ebb; the other was staying. Looking only at price, you can't tell which part will leave and which part is resetting the baseline.
Uncertainty Is Its Own Pricing Force
There's one more layer worth thinking through.
The core driver of this entire episode wasn't that tariffs arrived — it was the uncertainty over whether they might. Not a single tariff ever fell on gold, yet that uncertainty alone was enough to move $135 billion of physical assets across the Atlantic, break a GDP forecasting model, and keep global refineries running at full capacity for four months.
Uncertainty isn't just an adjective attached to some other risk factor. It's an independent variable in its own right, sitting alongside interest rates, inflation and growth — not subordinate to any of them.
This explains two phenomena that traditional models can't account for.
Why does gold sometimes keep rising after a risk event resolves? Because markets aren't pricing that one event — they're pricing how long this environment of sustained uncertainty will last. One concern gets answered; the next is already accumulating. Prices don't fall sharply just because a single event resolves, unless the broader uncertainty environment itself is systematically improving.
Why does gold sometimes rise even when real interest rates are climbing? In the standard model, higher real rates increase the opportunity cost of holding gold, so prices should fall. That logic holds in calm periods — but when the uncertainty premium is elevated, its upward pull can overwhelm the downward pressure from rising rates. A model that has no variable for uncertainty premium will perpetually misread gold, leaving you permanently confused about why gold isn't "following the model."
In February 2026, the US Supreme Court struck down most of Trump's tariffs imposed under the International Emergency Economic Powers Act; Trump immediately announced a blanket 10% global tariff on all imports, with signals it could rise to 15%. The rules are still shifting. The uncertainty hasn't faded — it's just taken a new form. This logic is still running.
Free Signals Any Investor Can Track
There's a practical question at this point: are these institutional-grade signals actually accessible to ordinary investors?
Yes — and none of them require a paid subscription.
COMEX gold inventory is the most direct measure of physical flow. CME updates it daily; it can also be tracked in real time through third-party sites like silveroftruth.com/tools/comex-inventory or metalcharts.org/comex/gold. A rapid rise in inventory means gold bars are flying into New York — usually driven by some form of policy uncertainty pushing institutions to move physical metal. A sustained decline means that wave of accumulation is unwinding. During the 2024–2025 episode, inventory climbed from 17.1 million to 43.3 million ounces in plain sight. Anyone could have seen it.
Swiss gold trade data is another leading indicator. Switzerland is the world's largest gold refining and transit hub; its export volumes to the US almost directly reflect the pace at which markets are shipping gold stateside. The Swiss Federal Customs Administration publishes monthly data at month-end; Reuters and Bloomberg cover it regularly. When that number shows an unusual spike, something worth investigating is driving it.
The EFP spread itself is harder for retail investors to track directly, since it's OTC data with no public real-time feed. A workable proxy: pull up spot gold and COMEX near-month futures simultaneously in any charting platform; if the gap between them starts widening, that's a EFP expansion signal. The World Gold Council and StoneX publish regular gold market reports that include weekly or monthly EFP data — no paid subscription needed, just search the report titles.
These three indicators together reconstruct a picture of institutional-level gold flows. No inside information required. No Bloomberg terminal required. Just knowing where to look.
Price Is the Outcome. Friction Is the Cause.
Walk the full chain one more time.
Late 2024: Trump elected, tariff anxiety begins spreading through institutional gold desks. Major banks cover short positions, start moving physical gold to the US. EFP expands past $60. Arbitrageurs pile in. Gold flows from London through Switzerland to New York; COMEX inventory rises 153% in four months. GDPNow misreads the gold import surge as a consumption collapse, issues a -2.8% reading, and gets its model rewritten. April 2, 2025: tariff exemption announced, EFP compresses, gold starts flowing back out of New York, US gold exports hit successive records, Hong Kong overtakes the UK as the second-largest buyer by early 2026.
Every node in that chain left a trace in publicly available data. None of it required inside information. The EFP widening was friction. The COMEX inventory surge was friction. GDPNow changing its model was friction. Gold exports beating semiconductors and aircraft was friction becoming too large to hide inside macroeconomic statistics.
Someone who understood that chain, and someone who only watched price go up and down, looked at the same market and drew different conclusions. The price-watcher panicked during the pullback, not knowing whether the underlying logic had changed. The friction-reader knew what to ask first: is COMEX inventory falling? If yes, the arbitrage tide is going out — short-term friction unwinding, not a structural reversal, pullback is normal. If inventory is stable and Swiss export data shows no new anomaly, the pullback is probably sentiment, not a change in the physical flow underneath.
On the other hand, if COMEX inventory starts rising sharply again, if Swiss exports to the US spike again, if the EFP starts widening again — that means a new round of institutional-scale physical movement is already underway. Something systemic is being worried about. Find out what that is before the headlines tell you.
One scenario is short-term noise. The other is a new structural signal. They call for completely different responses.
Next time gold is rising, don't just look at the number. Watch where the bars are flying — then ask: who's buying this time, and are they going to stay?
This article is intended for investor education only and does not constitute investment advice. All data cited is from publicly available sources. Past performance does not indicate future results.
Recommended Articles


Comments (0)
Click the $ button, enter the symbol, and select to link a stock, ETF, or other ticker.