

April 2026 CPI Preview: Will Hot Inflation Crush Nasdaq, S&P 500 & NVDA? Explosive Market Reaction Guide


AI Podcast
March CPI surged to 3.3% YoY, driven by an 18.9% gasoline price increase, with core CPI at 2.6%. April forecasts anticipate further energy price impact. A soft CPI print would boost equities, particularly high-duration growth stocks, and weaken the USD. Conversely, a hot print suggesting broader inflation would pressure equities, strengthen the USD, and extend the "higher for longer" rate outlook. An in-line print would likely result in minimal market reaction, shifting focus to PCE, Non-Farm Payrolls, and Retail Sales data for future policy clues. Rate cut expectations for 2026 have diminished.

TradingKey - March 2026 CPI numbers came in very strong, delivering a hefty inflation blow in the aftermath of the US-Iran conflict. The headline measure shot up to +3.3% year-over-year – the best since May 2024 – on an energy shock that pushed gasoline prices up 18.9% YoY. Month-over-month, headline CPI soared +0.9%, the strongest one-month increase since June 2022. That move took gasoline prices up an astonishing +21.2% month-over-month.
On a core basis (excluding food and energy), the measure was slightly contained, rising +2.6% year-over-year and +0.2% month-over-month – below the 2.7% consensus expectation.
For April, Wall Street expects the energy overhang to intensify further. The consensus forecast calls for headline CPI of +3.7% YoY (range: 3.6%–3.8%) and a monthly gain of +0.6%. Core CPI is forecast at +2.7% YoY with a +0.3% monthly gain. Wells Fargo stands out on the hawkish side of estimates, forecasting +3.8% for headline and +2.9% for core CPI.
On its part, the Cleveland Fed's Nowcasting model, updated daily, pegs April CPI at 3.56% YoY – slightly below consensus due to the expected mean reversion in gasoline prices.

Source: Forexfactory
Bottom line: Inflation remains sticky and the markets will look for evidence of core inflation broadening into services. Given that crude oil prices surged from the mid-$70s in February to above $118/barrel by the end of March, April headline CPI is all but guaranteed to print above the tame 2.4% reported for February. How far that overhang moves into core services inflation will dictate market reactions.
CPI Scenarios & Outcomes
Scenario 1: Soft Print (Headline ≤3.5%, Core ≤2.5%)
Any substantial undershoot vis-a-vis market expectations, particularly on the core CPI side, should result in an immediate repricing of asset classes based on forward-looking inflation expectations and interest rate projections. Historically, the mechanics behind this trade-out are clear: lower inflation leads to reduced real yields, which drives up multiples and equity valuations, especially for high-duration growth stocks.
For example, in the aftermath of the July 2023 CPI numbers print (3.2% headline against an expected 3.3%), the Nasdaq rallied over 1% intraday and added roughly 100 basis points to the S&P 500. Moreover, in the context of the hot November 2022 CPI release (miss of 7.7% vs. 8.0% expected), the Nasdaq saw a 7.4% single-day spike with 10-year Treasury yields contracting by 28 bps.
Source: Tradingview
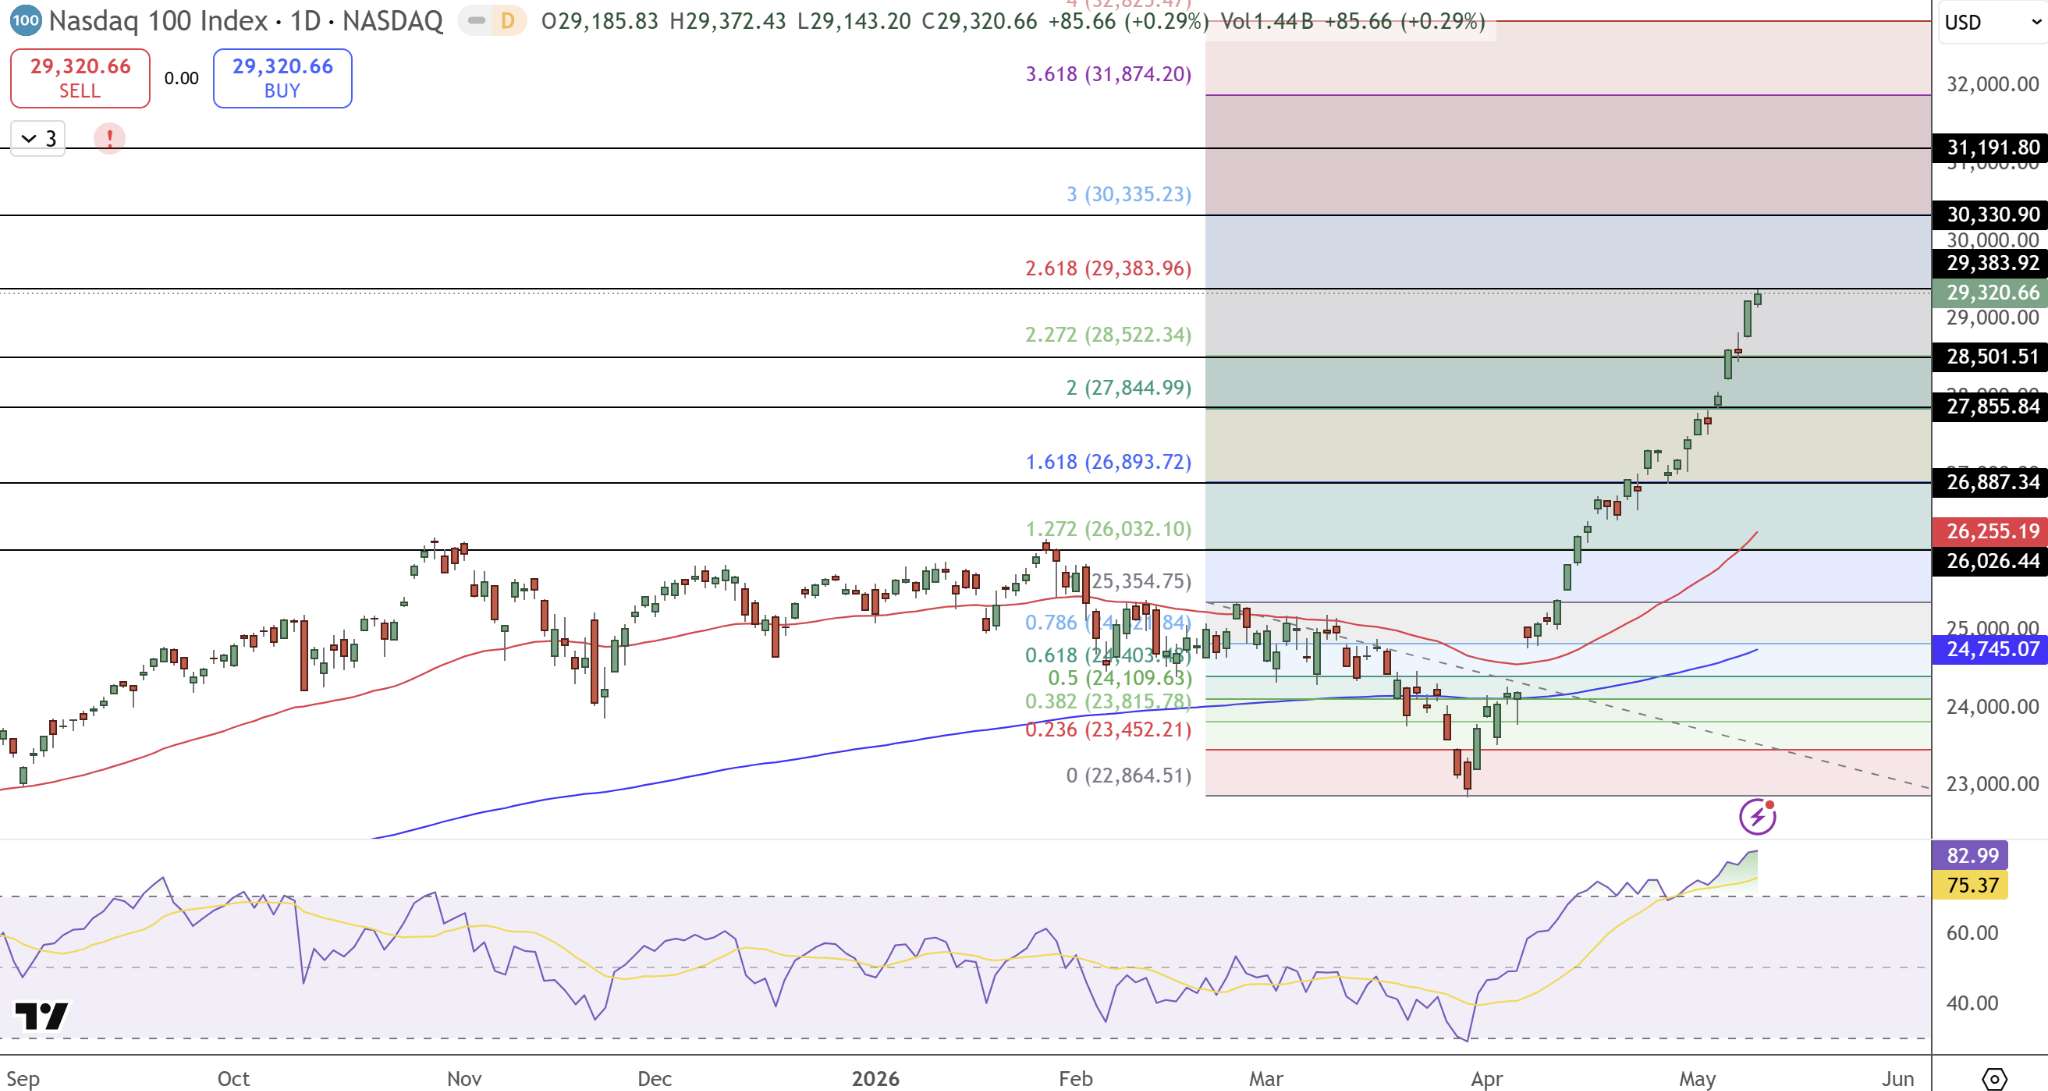
Given an April 2026 soft print, expect the S&P 500 to rally by 1.5%-2.5% on an intraday basis, while the Nasdaq outperforms in line with a high duration profile (expect gains of 50 bps to 100 bps). The Dow underperforms as a relatively defensive basket.
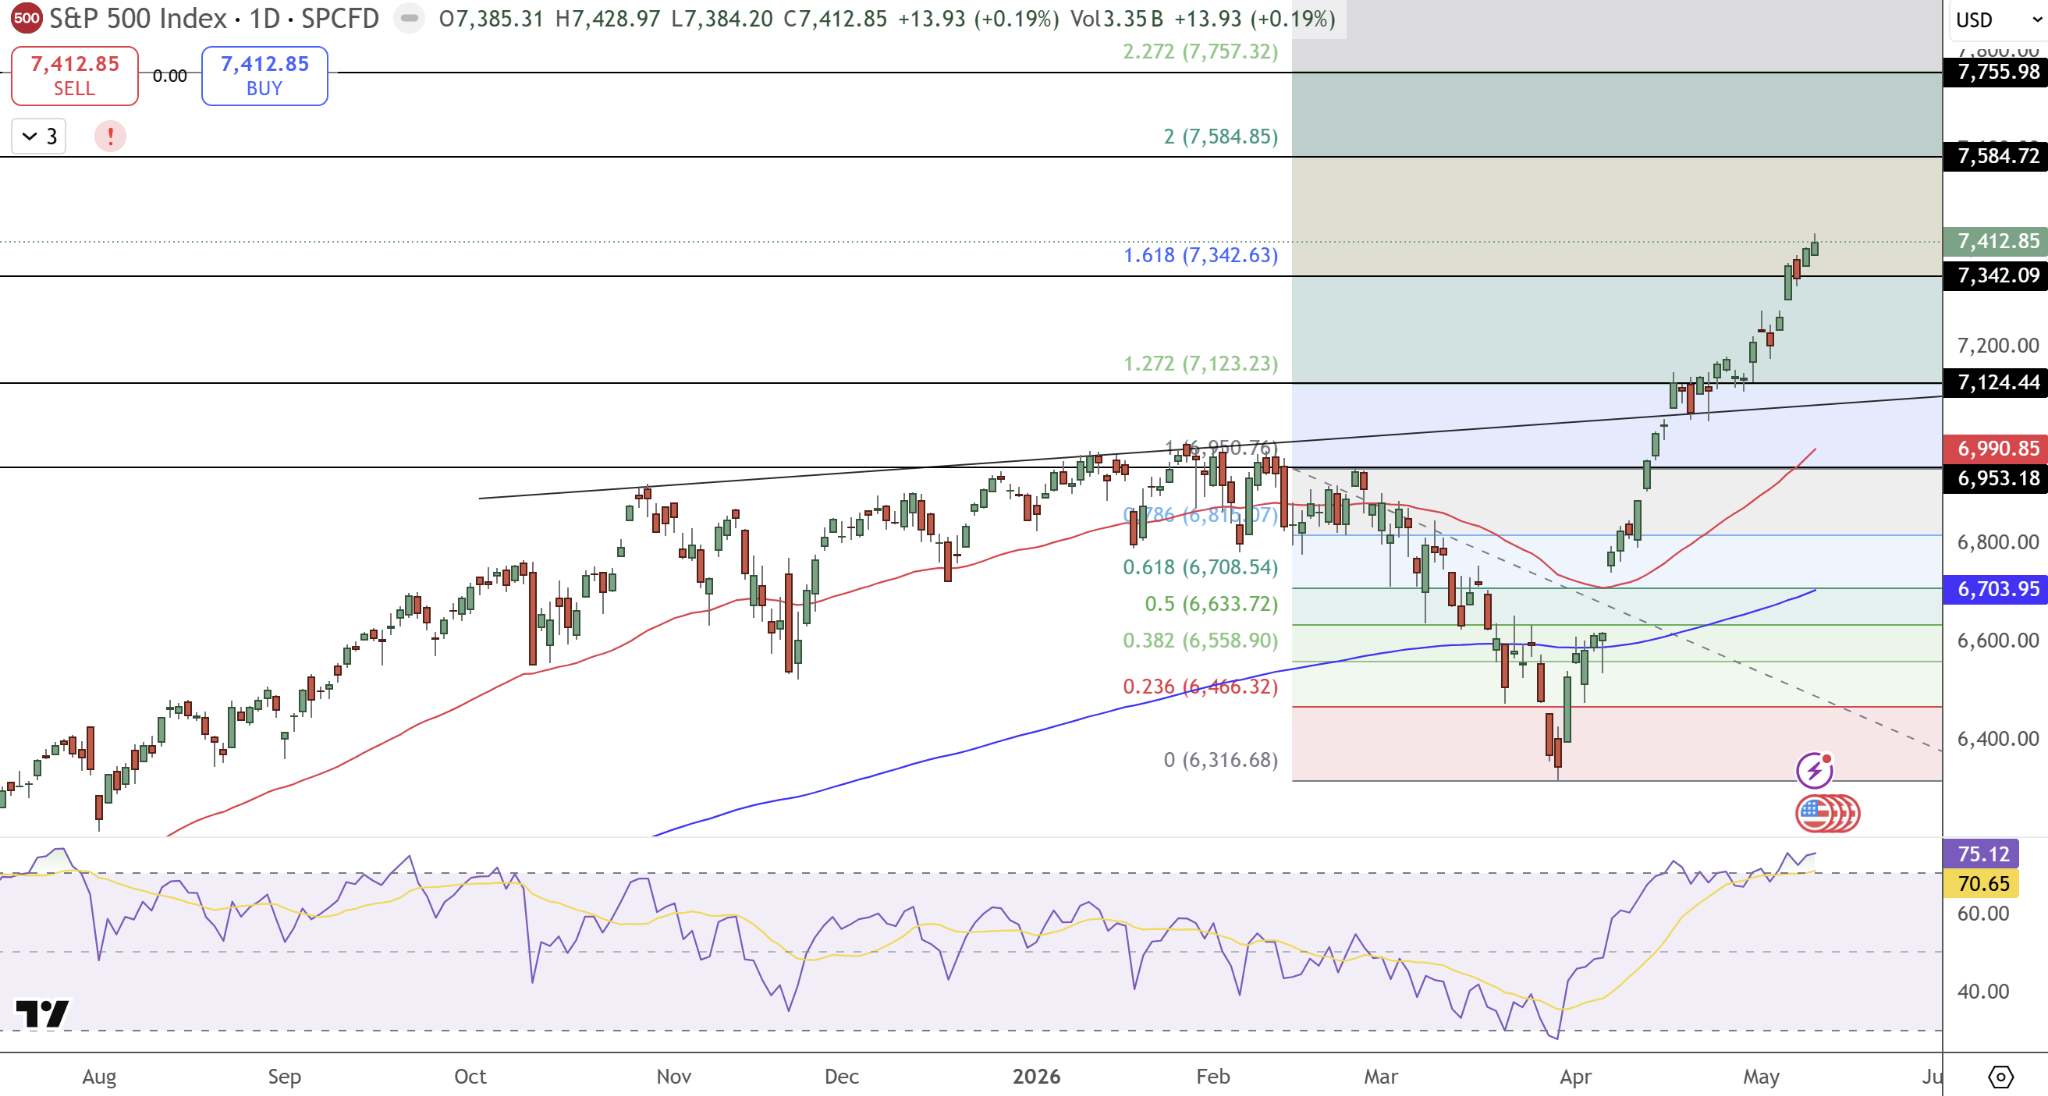
Source: Tradingview
The US dollar (DXY) falls -0.5% to -1% as the prospect of rate cuts is accelerated, driving 10-year yields down 10-20 bps towards 4.0%.
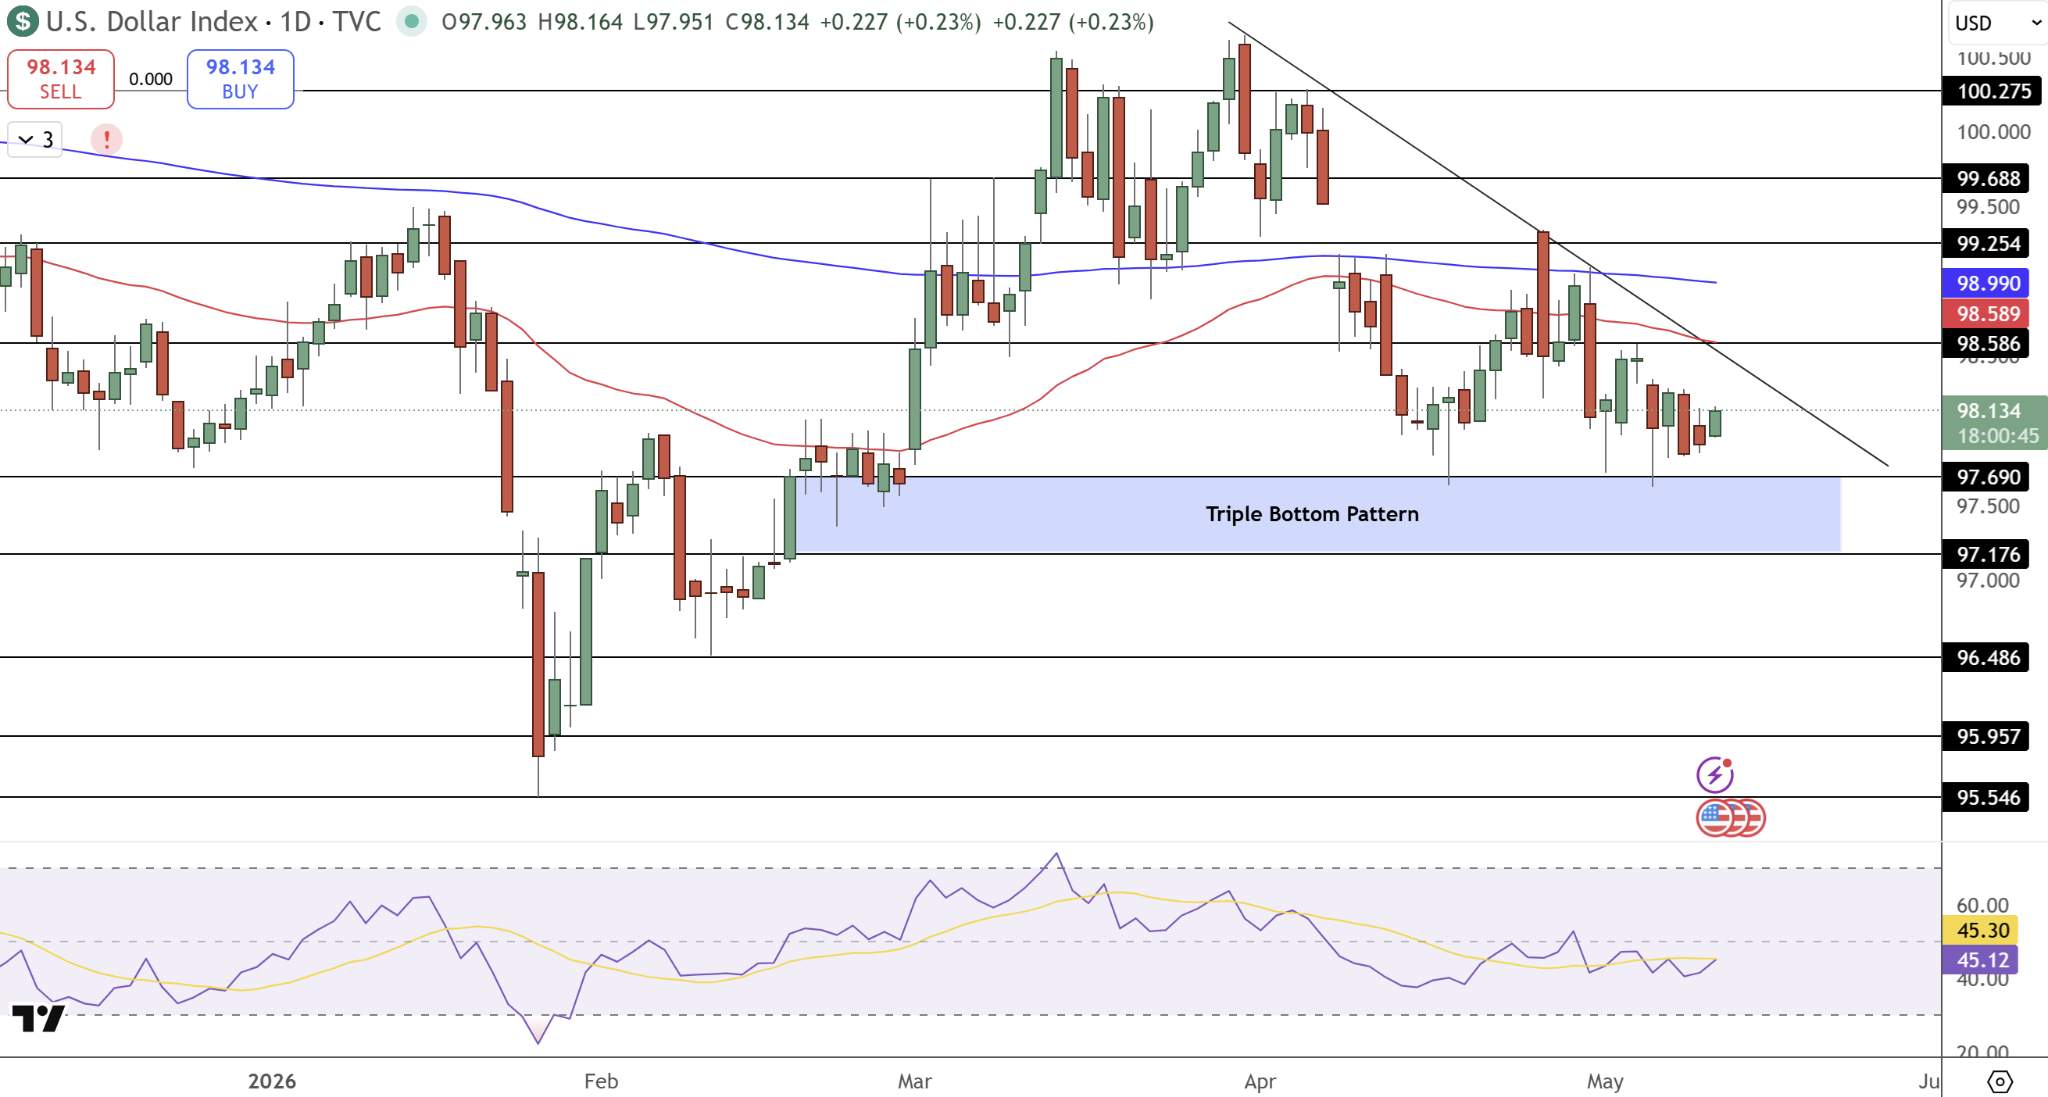
Source: Tradingview
Within equities, the primary beneficiaries of such a print should be high-multiple stocks. Semiconductor names (e.g., NVDA and AMD) should jump as artificial intelligence infrastructure investments remain rate-sensitive. Cloud computing and software-as-a-service providers (SaaS; think Salesforce, ServiceNow, MongoDB) experience valuation multiples growth as their discounted cash flow (DCF) models are highly sensitive to discount rate changes. Pre-revenue biotech names, whose NPVs are contingent on future revenues, should jump. ETFs focused on momentum plays (MTUM) and high-beta themes will provide the best way to capture the trade.
Scenario 2: Hot Print (Headline ≥3.9%, Core ≥2.9%)
On the flip side, if inflation proves stickier than expected by moving into services and other categories (transportation, shelter), it reinforces the Federal Reserve's pause and could even spark a repricing towards a more hawkish rate outlook. This looks more likely given the ongoing US-Iran energy tensions that seem to be the main driver of CPI inflation in the first place.
Under the hot print scenario, the S&P 500 would fall 1.5%-2.5% on an intraday basis, with the initial reaction happening at the start of trading hours. The Nasdaq would lag even further – declining by 2%-3.5% as real yields rise and compress growth equity multiples. Dow outperforms, as defensive sectors like energy, utilities, and financials would help. Names like Exxon Mobil (XOM) and Chevron (CVX) could be rewarded for the inflation-driven energy shock. Banks (JPMorgan, Goldman Sachs) can profit as well if the yield curve steepens.
As the hot CPI report emerges, the US dollar should appreciate +0.5% to +1.5%, negatively impacting foreign currency-denominated assets. 10-year Treasury yields should move towards 4.6%-4.8% range – exerting even more pressure on growth stocks. Semiconductor stocks focused on AI infrastructure (NVDA, AMD, SMCI) could face the brunt of that pressure. High multiple names like SaaS providers and speculative biotech stocks, which already have elevated valuations and implicit low discount rates baked into stock prices, would also underperform.
Scenario 3: In-Line Print (Headline 3.6%–3.7%, Core 2.6%–2.7%)
Finally, an in-line print is unlikely to elicit much reaction from traders. Markets are already priced in those levels, and we are unlikely to see much intraday volatility. S&P 500 will stay relatively flat, fluctuating by ±0.5%. Nasdaq may drift mildly higher, treating a lack of negative news as a small positive event.
Investors would quickly switch their focus to forward-looking data, particularly April PCE inflation (late May report, Fed's preferred measure); May non-farm payrolls (mid-May) and retail sales (end of May). Fed minutes and Chair commentary at upcoming engagements would carry outsized weight, as traders parse language around "sufficient progress" toward the 2% target.
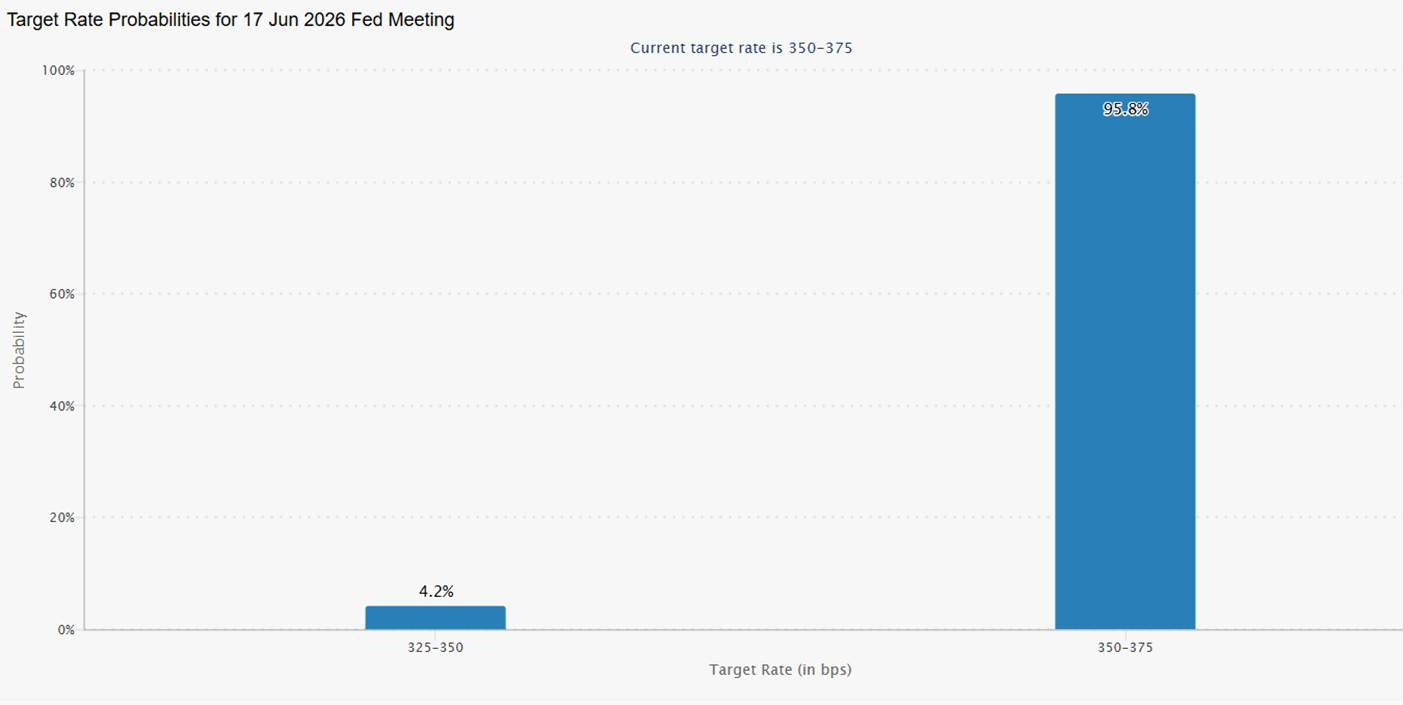
Forward Rate Cut Odds & CPI Projections vs Fed Target
Given the Fed's 2% inflation target, recent CPI developments paint a worrying picture. From March's 3.3% to expected April 3.7%, the gap between headline and target is only widening. As per the CME FedWatch, traders see no rate cuts in 2026 at all, reversing their expectations from a few months ago, when one quarter-point cut was still in the works.
Bank of America has extended its first rate cut to the last six months of 2027, while JPMorgan keeps CPI above 3.0% until early 2027.
Source: Forexfactory
A soft April print (≤3.5%) could revive speculation about a late-2026 cut and meaningfully lift rate-sensitive assets. In the opposite scenario – hot CPI numbers (≥3.9%) – markets would essentially have to adjust expectations for a "higher for longer" Fed rate hike cycle, despite valuations of high beta AI/tech stocks implying quite optimistic discount rates going forward.
What Comes Next After CPI: The Forward Guidance
Moving past today's CPI report, the near-term macro data calendar is dominated by three major events:
PCE Price Index for April: This forward-looking inflation indicator is due out later in May, around May 30, and investors will be analyzing it to gauge if the energy shock is expanding into services consumption.
Non-Farm Payrolls for May: Due out in mid-May, this report will determine if inflation is also coming down thanks to slowing jobs creation.
Retail Sales (end-of-May): Another important measure of consumers' tolerance of rising prices and willingness to spend.
Recommended Articles


Comments (0)
Click the $ button, enter the symbol, and select to link a stock, ETF, or other ticker.