

What to Look out for Gold After Fed Meeting?


AI Podcast
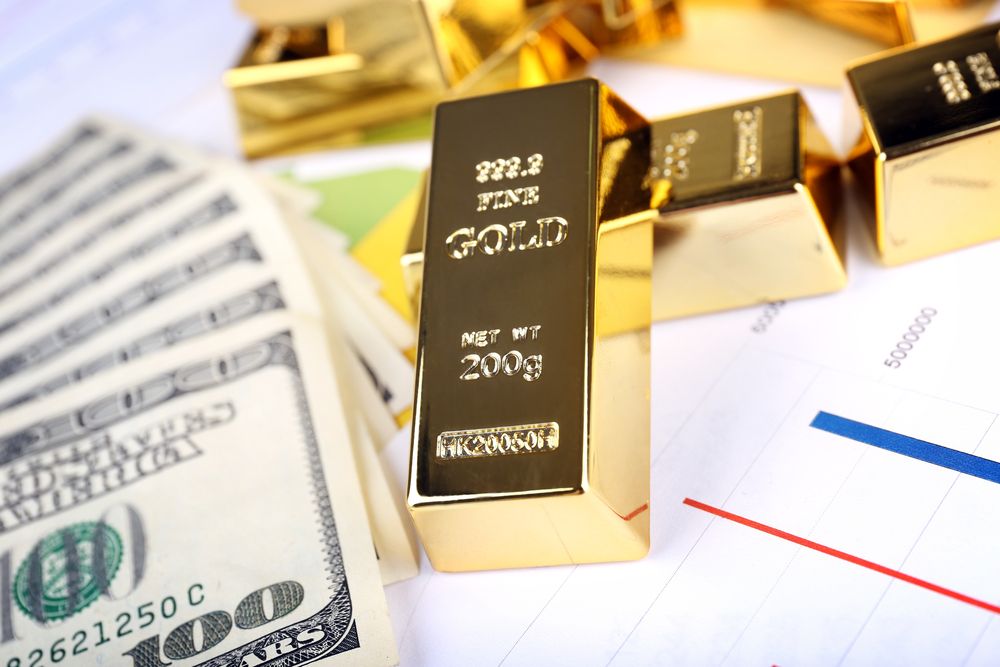
Gold is trading around $5,000-$5,100 per ounce, showing resilience despite recent pullbacks from all-time highs. Key drivers include geopolitical tensions, central bank buying, persistent inflation, and a weakening dollar. The upcoming Fed meeting on March 18 is critical; a dovish tone could boost gold, while a hawkish surprise may pressure prices. Elevated real yields and dollar strength currently limit upside. However, structural demand and stagflation risks support a long-term uptrend, with institutional forecasts suggesting $5,055-$6,200+ by late 2026. A 5-10% allocation via ETF is recommended.
This is a big week for gold (XAU/USD). The Fed's rate decision hits on March 18 at 2:00 p.m. ET, Powell follows at 2:30 pm - and the market is looking closely to see how gold reacts.
As of the latest LBMA benchmark print, gold is trading at $4,986.90 per ounce (March 16, 2026). Gold has climbed over 140% from the $2,100 area just two years ago - a move that's hard to ignore no matter how long you've been watching markets. The catalysts for the uptrend are - persistent geopolitical tensions, steady central bank buying, inflation that hasn't fully gone away, and a dollar that's been losing ground. No single reason, just several that kept reinforcing each other.
Gold recently hit all-time highs above $5,500 - $5,627 in January 2026 before pulling back to current levels. And that brings us to this week - arguably the most closely watched Fed meeting of the year.
So what's actually driving gold right now, and where does it go from here? Whether you've been trading for years or you're just starting to figure out what all the fuss is about - here's what you need to know before Wednesday.
SECTION 1 - MARKET SNAPSHOT
Current Gold Price
Gold is currently trading around $5,000-$5,100 per ounce - a level that has become psychologically important for both retail and institutional investors. As a reference point, the official LBMA Gold Price (PM fix) on March 16, 2026 came in at $4,986.90/oz. Think of the LBMA fix as the market's official 'closing price' - the most trusted benchmark used by banks, central banks, and jewellers worldwide.
Gold pulled back sharply from the January All Time High levels of $5,597, a correction of approximately 9% -10% - consistent with healthy consolidation in a structural uptrend rather than trend reversal.
Recent Volatility
Why did Gold dip during a geopolitical crisis? While conflict typically sends investors rushing to gold for safety, the current market is being dictated by the Federal Reserve. We recently saw gold retreat despite supply risks in the Strait of Hormuz and a spike in oil prices. To a beginner, this price action seems 'odd,' but the technical explanation lies in the macro data: rising Treasury yields (~ 4.2 - 4.3%) and a strengthening USD. Because gold pays no interest, it struggles to compete when real yields by Treasury Inflation-Protected Securities are elevated at nearly ~ 1.78 - 1.91% (FRED:DFII10). Essentially, the market is betting that high energy prices will force the Fed to keep interest rates high, some investors move money out of gold and into interest-bearing assets instead.
Key Macro Headlines
Headline | What It Means for Gold |
🏛️ FOMC Decision - March 18 | Rate held steady expected (~99% probability). Real focus: dot plot, tone, SEP revisions. Any dovish tilt = gold bullish; hawkish surprise = headwind. |
📈 Gold up 66%+ YoY | Structural demand from central banks, de-dollarisation, and inflation hedging driving multi-year uptrend. |
⚔️ Middle East Conflict (Iran-linked) | Geopolitical safe-haven demand supporting price floor. Escalation = upside spike risk. |
🛢️ Oil at $95+ (WTI) | Rising energy prices stoke inflation fears → complicates Fed's path → stagflation risk → historically gold-supportive. |
💵 USD / Treasury Yields | 10Y nominal ~4.27%, real yield (TIPS) ~1.78–1.91%. Elevated real yields limit gold's near-term upside. |
🏦 Central Bank Buying | ~585 tonnes/quarter demand from central banks (JPMorgan estimate) provides structural price floor. |
SECTION 2 - WHAT IS DRIVING GOLD
Gold rarely moves in isolation - it’s constantly reacting to rates, inflation, and global risk sentiment. Understanding the key drivers is essential for any investor - whether you are buying your first gold ETF or managing a multi-asset portfolio. There are five primary forces at work in the current market.
Fed Rates
Gold is a non-yielding asset - it does not pay interest or dividends. This means it competes directly with interest-bearing investments. When the US Federal Reserve raises rates, bonds and savings accounts become more attractive, so some investors move money out of gold. The critical variable is not nominal rates but real yields (inflation-adjusted). The 10-year TIPS yield (FRED:DFII10) at ~1.78–1.91% represents the true opportunity cost of holding gold.
Historically, a sustained decline in real yields is one of the most reliable bullish catalysts for XAU/USD. When rates fall or are expected to fall, gold becomes more appealing. Right now, markets expect the Fed to hold rates steady at 3.50%–3.75% at the March 18 meeting (~99% probability of Hold/No Change) , but investors are listening closely to how the Fed talks about the future path of rates - that language matters more than the decision itself. The March meeting's Summary of Economic Projections (SEP) and revised dot plot will be scrutinised for any shift in the implied rate path.
Ø A "hawkish hold" - where the Fed holds but removes 2026 cut expectations - would likely push real yields higher and pressure gold toward the $4,950–$5,000 support zone.
Ø A "dovish hold" - acknowledging slowing growth or disinflation - would be the single most powerful near-term bullish catalyst for XAU.
Inflation
Rising oil prices (WTI ~$95+) are feeding into inflation headlines and complicating the Fed's easing path - a dynamic known as stagflation risk (high inflation + slowing growth). Historically, stagflation environments are strongly bullish for gold, as the asset benefits from both the inflation hedge demand and the expectation of eventual policy accommodation.
Gold has been used as an inflation hedge for centuries. When the purchasing power of paper money falls - i.e., when everything gets more expensive - gold tends to hold its value. With inflation still elevated above the Fed's 2% target and oil prices pushing higher, gold is benefiting from the fear that the cost of living will remain high for longer.
Geopolitics
Geopolitical risk contributes to gold in two distinct ways: tactical spikes (immediate safe-haven flows on news) and structural premium (persistent elevation of gold's risk bid). The current cycle has both. The US-Israel-Iran dynamic raises the risk of Strait of Hormuz disruption, which would be simultaneously inflationary (oil spike) and risk-off (equity selloff) - a rare double-bullish scenario for gold. However, de-escalation is the key risk to monitor: any diplomatic breakthrough or ceasefire would rapidly unwind the geopolitical premium and expose gold to technical selling toward $4,900–$4,940.
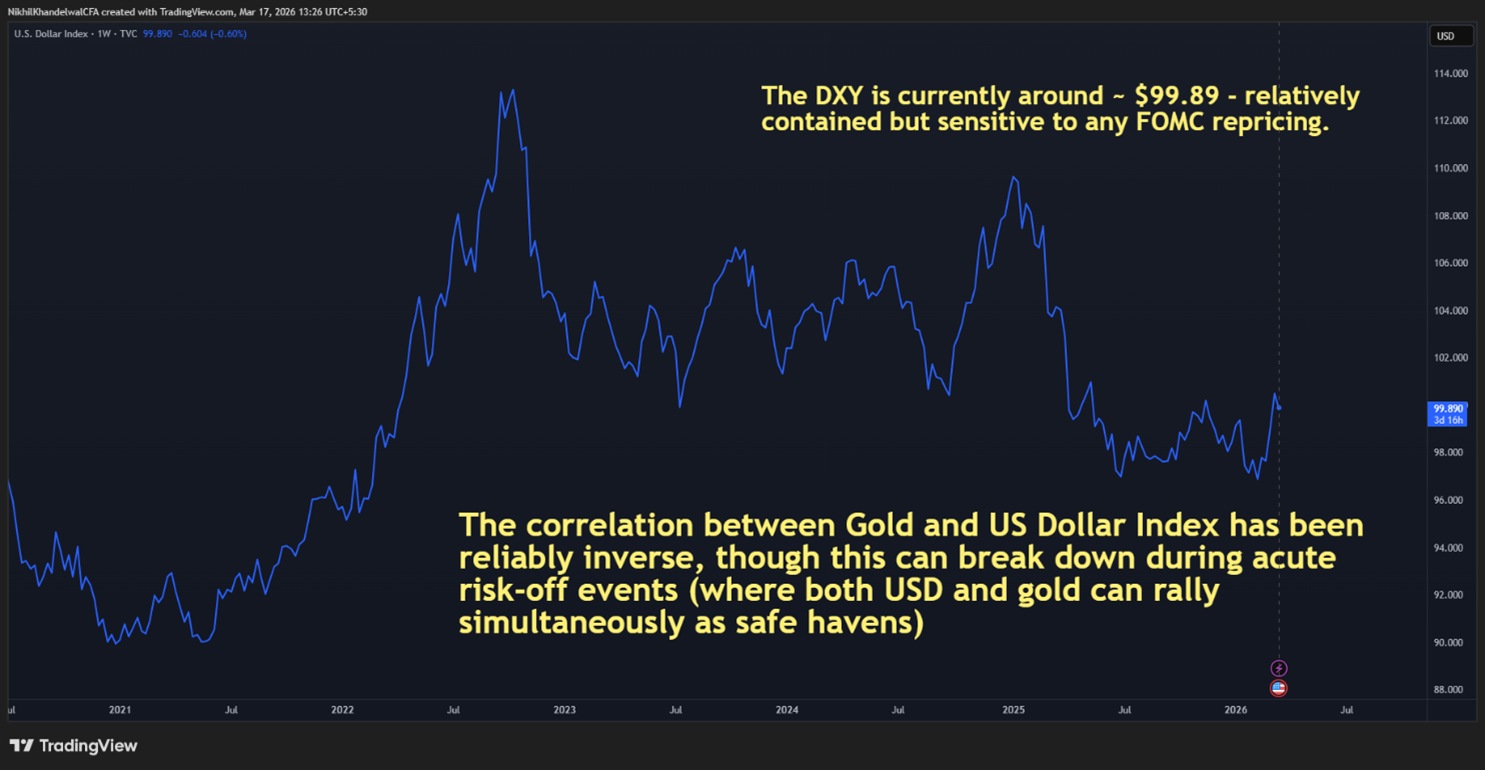
USD Strength
Gold is priced in US dollars worldwide. So, when the dollar gets stronger, gold automatically becomes more expensive for buyers in other countries, which can reduce demand and push the price down. Conversely, when the dollar weakens, gold becomes cheaper for international buyers, boosting demand. This is why a stronger dollar often hurts gold prices - and why a weaker dollar is typically bullish for gold.
Watch the US Dollar Index (DXY) as a simple proxy: DXY up = gold headwind; DXY down = gold tailwind.
SECTION 3 - TECHNICAL ANALYSIS
The technical picture confirms the macro narrative: gold remains in a long-term structural uptrend but is in a short-term consolidation phase ahead of the FOMC catalyst. The $5,000 level is not just a price - it is a psychological and technical battleground that will largely determine the next directional move.
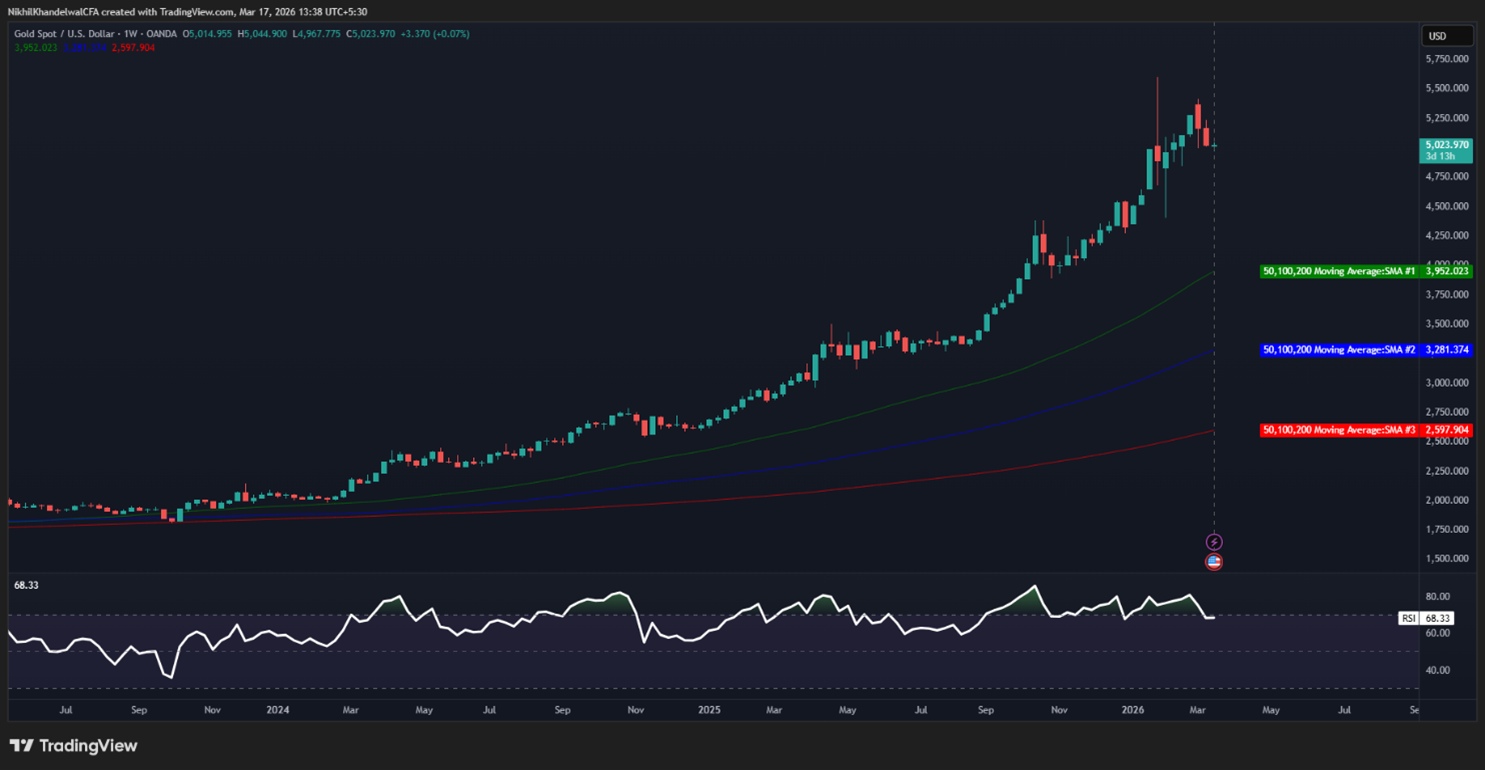
Momentum Indicators (RSI / Moving Averages)
o 50-day Moving Average: $3952.023
o 100-day Moving Average: $3281.374
o 200-day Moving Average: $2597.904
The trend and momentum picture as of mid-March 2026:
• 200-day Moving Average: Gold is trading above its 200-day MA - the gold standard of long-term trend confirmation. The structural uptrend remains intact.
• 50-day Moving Average: Short-term momentum is cautious. Watch for a 50/200-day MA crossover ("golden cross" if upward, "death cross" if downward) as a directional signal.
• RSI (14-day): Showing neutral-to-slightly-bearish readings in the near term - neither overbought nor oversold - consistent with a consolidation phase ahead of the FOMC catalyst.
Post-FOMC "Repricing Window": The 48-72 hours following the March 18 announcement typically sets the tone for weeks ahead. The immediate reaction is often the key directional signal to trade
SECTION 4 - PROBABLE GOLD MOVEMENTS SCENARIOS & INSTITUTIONAL FORECASTS
The forecast for gold hinges heavily on the March 18 FOMC outcome and its messaging. We present three clearly defined scenarios. Note: the first 24 - 72 hours after the Fed can be noisy - the 1-3-month trend is more important than the initial knee-jerk reaction.
⚖️ Base Case
Trigger: Hawkish hold, limited change The FOMC delivers a hold with limited 2026 cuts priced in. Initial volatility tests $4,950-$4,980 support but structural buying absorbs the dip. Over the following 4-12 weeks, the combination of central bank demand, geopolitical risk premium, and gradual disinflation push gold back toward $5,200-$5,400 by mid-to-late 2026. JPMorgan's Q4 2026 target of ~$5,055 and Goldman Sachs's year-end target of $5,400 bracket this range. What would confirm this: Fed holds but maintains 1-2 2026 cuts in dot plot; Powell neither hawkish nor dovish; gold bounces within 48 hours of initial selloff; $5,000 holds on weekly close. |
🐂 Bullish Case
Trigger: Dovish surprise or geopolitical escalation Powell acknowledges labour-market softening or signals openness to earlier cuts. Combined with a Middle East escalation or weaker-than-expected US data, gold swiftly rebounds above $5,200 and retests the January ATH zone near $5,500–$5,600. In an extreme risk-off scenario (oil shock, financial stress, geopolitical black swan), the path to $6,000+ opens. UBS targets $6,200; Deutsche Bank/SocGen see ~$6,000 as plausible if stagflation deepens. What would confirm this: Dot plot adds 2026 cut; Powell references "cooling labour market" or "disinflation progress"; real yields (FRED:DFII10) fall 15+ bps post-FOMC; gold closes above $5,200 within 3 trading days. |
🐻 Bearish Case
Trigger: Hawkish FOMC surprise The Fed removes 2026 rate cuts from projections or explicitly signals a higher neutral rate. This triggers a surge in real yields (FRED:DFII10) and a dollar rally (TVC:DXY breakout). Gold breaks decisively below the $4,980–$5,000 support band and targets the $4,800–$4,850 major support zone. A sustained weekly close below $4,850 would seriously question the structural bull thesis and expose $4,500–$4,600 on a 3–6 month view. What would confirm this: Dot plot shows fewer than 1 rate cut in 2026; Powell uses language like "higher for longer" or "inflation re-acceleration risk"; DXY breaks above 102. |
INSTITUTIONAL FORECASTS
Institution | 2026 Price Target | Key Driver |
JPMorgan | ~$5,055 (Q4 avg) | ~585 tonnes/qtr central bank + investor demand |
Goldman Sachs | $5,400 (YE 2026) | Net Western ETF inflows, fiscal/debasement hedging |
ING | $5,450 (Q4 proj.) | Rate path softening, structural demand |
UBS | $6,200+ | Stagflation scenario, diversification flows |
Deutsche Bank / SocGen | ~$6,000 | Inflation persistence, geopolitical premium |
Scotiabank | ~$4,100 (conservative) | Rate normalisation, risk-on equity rotation |
SECTION 5 - CONCLUSION
Gold enters the March 18 FOMC week sitting at a critical crossroads. The $5,000 level is the line in the sand: hold it and the path back toward all-time highs above $5,500 remains open; lose it convincingly and a deeper correction toward $4,850 - $4,900 becomes the near-term story. The Fed's tone - not its rate decision - will be the catalyst.
The structural bull thesis (central bank demand, de-dollarisation, stagflation risk) is intact. Use the post-FOMC reaction to calibrate positioning - watch real yields (FRED:DFII10) and the dollar (TVC:DXY) as your daily indicators. Institutional consensus from JPMorgan, Goldman Sachs, UBS, and ING points to $5,055-$6,200+ by late 2026, making the medium-term risk/reward skewed to the upside.
Gold remains a compelling long-term hedge against inflation, currency weakness, and geopolitical risk. A 5 -10% portfolio allocation via ETF, held through FOMC noise, is the most sensible approach.
Recommended Articles


Comments (0)
Click the $ button, enter the symbol, and select to link a stock, ETF, or other ticker.