Ripple Price Forecast: XRP nears oversold territory as traders eye buying opportunities



- XRP holds around $1.20 amid broader sell-off as mounting US regulatory concerns weigh on the crypto market.
- XRP’s decline triggers $22 million in liquidations over 24 hours, but futures Open Interest rises to 2.33 billion XRP, suggesting growing retail demand.
- Technically, XRP remains capped by overhead moving averages and bearish momentum indicators.
Ripple (XRP) remains structurally capped near $1.20 after selling pressure wiped out the early-week rise to $1.34, driven by the United States (US) midterm elections. Market participants exhibited regulatory concerns ahead of the Democrats taking control of Congress in January, with many repositioning and adjusting their portfolios.
US regulatory concerns weigh on XRP
The broader cryptocurrency market continues to face growing headwinds as market participants raise concerns about the future of crypto regulation in the US after Democrats assume control of the House and Senate in January.
A Wall Street Journal report on Thursday said Senator Elizabeth Warren is set to chair the Senate Banking Committee. Warren is expected to advocate for stricter crypto rules and consumer protections for crypto entities.
The report highlights that Warren’s other initial priorities may include launching investigations into alleged insider trading in prediction markets and evaluating alleged conflicts of interest involving US President Donald Trump and his family. Although Warren's position as Senate Banking Committee Chair is yet to be confirmed, observers say the odds of another candidate are low.
“Democrats won this election by claiming we are on the side of working people, and working people are counting on us to deliver,” Senator Warren wrote in an opinion piece in Time on Thursday.
XRP derivatives liquidations surge
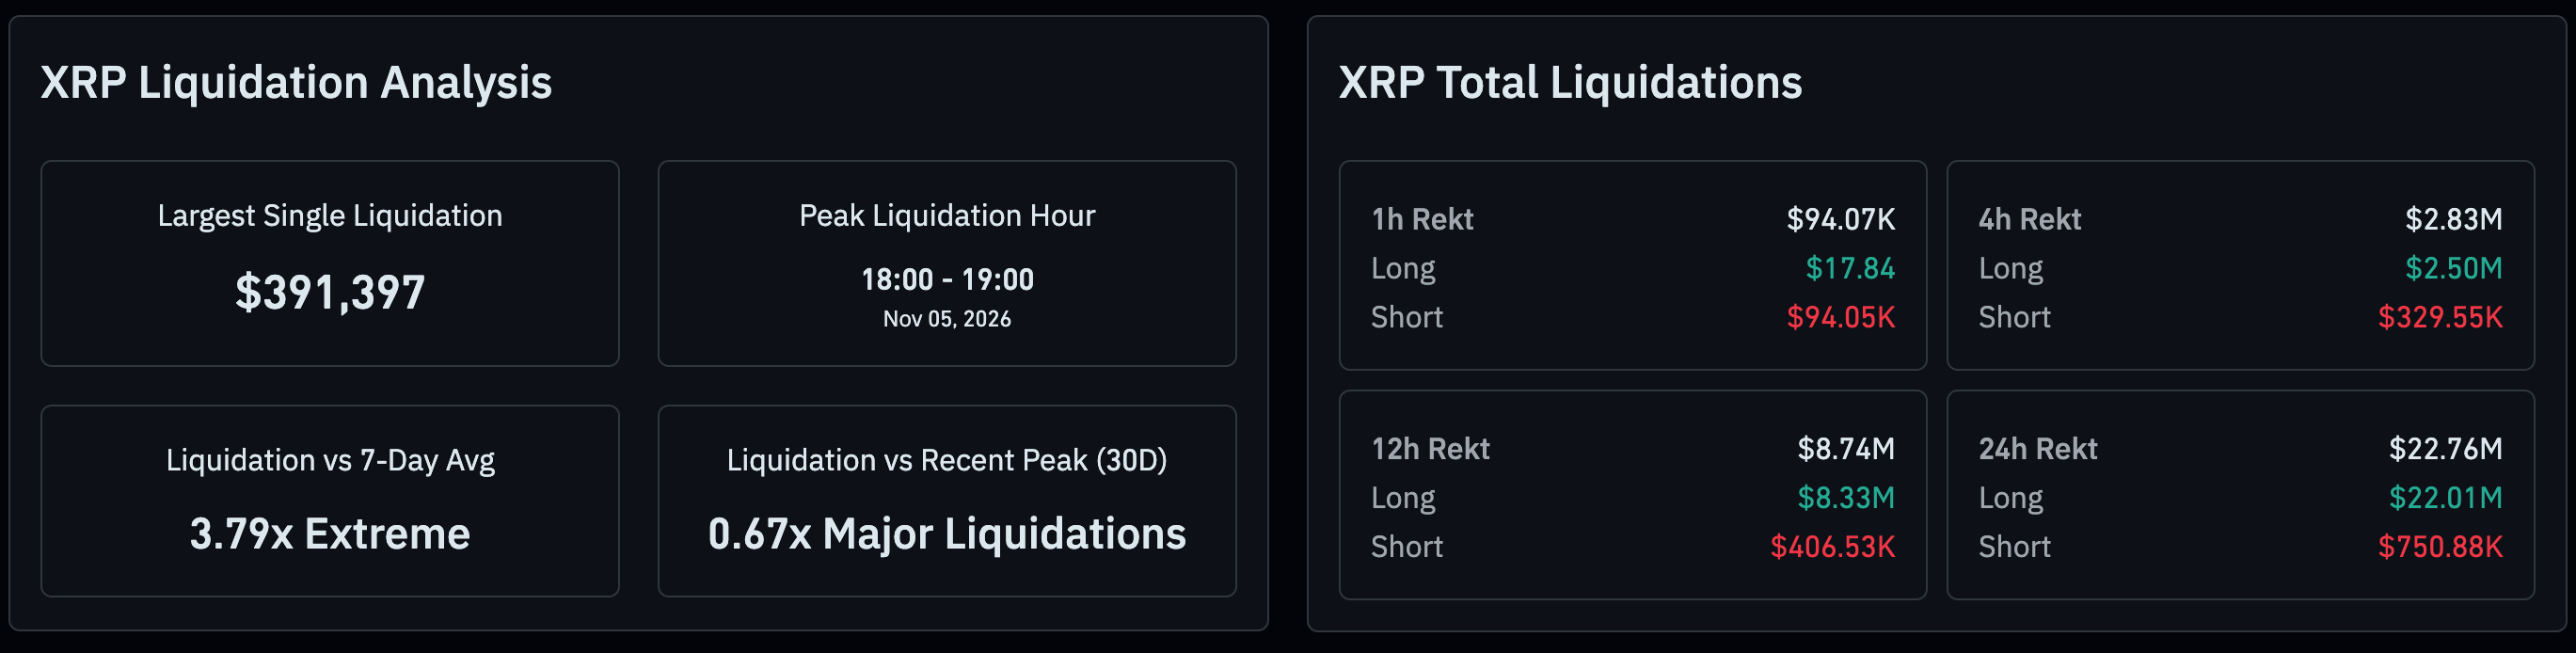
The sell-off in the broader cryptocurrency market has left many traders counting losses, especially in the derivatives market. Liquidations in the XRP derivatives market stand at $22 million over the last 24 hours on Friday. Long position traders took the biggest hit, with roughly $21 million wiped out, while short position traders lost nearly $1 million. Sustained long liquidations could accelerate the correction through forced selling and self-reinforcing price cascades.
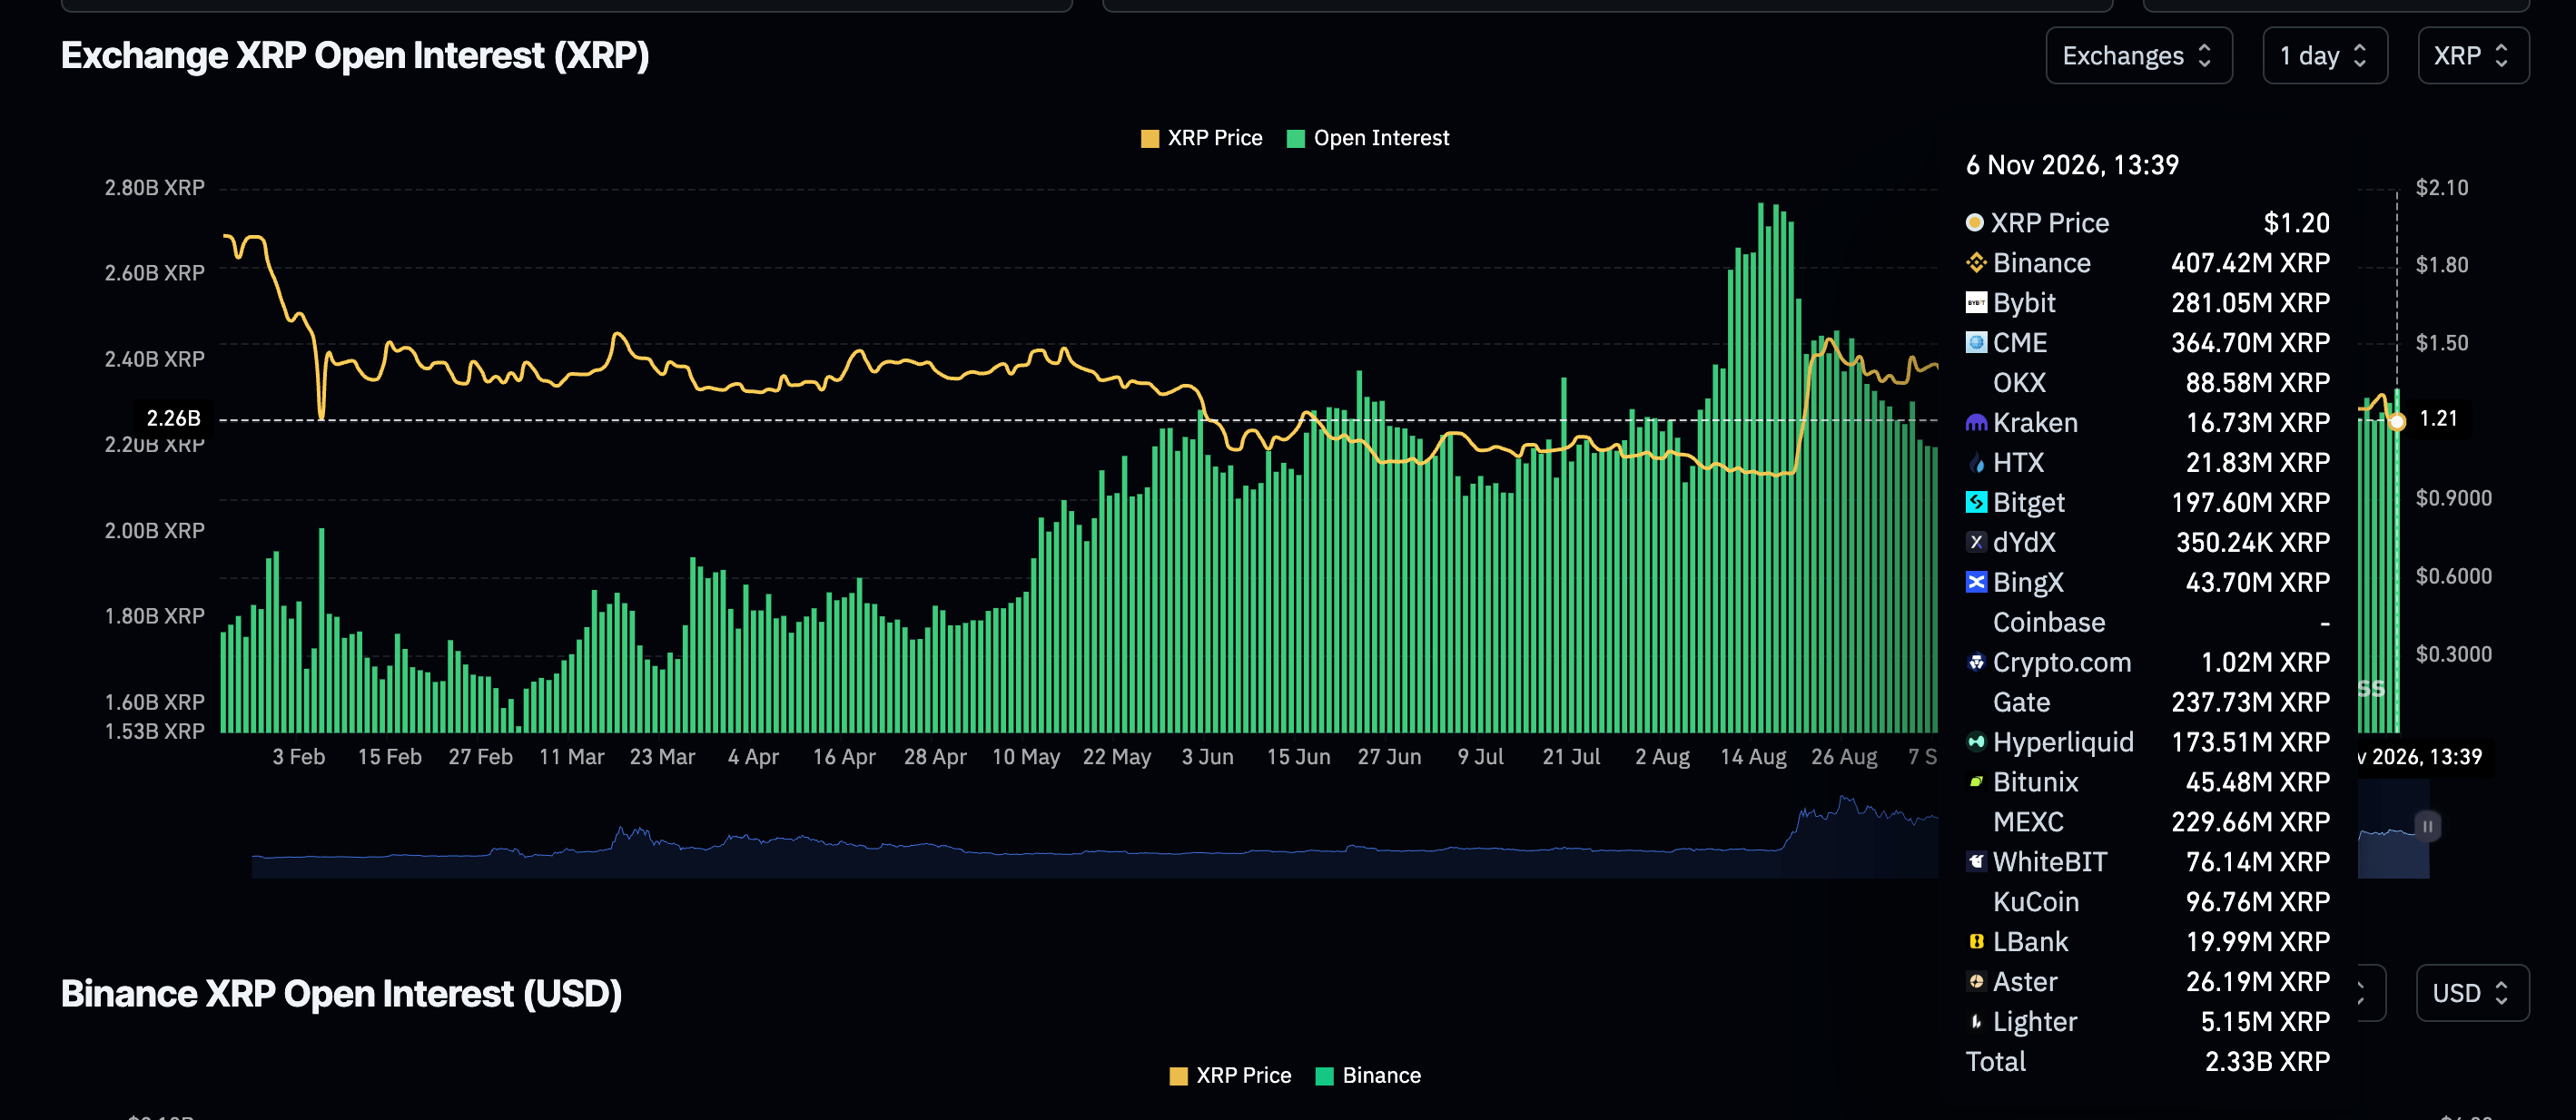
Still, bears should temper their expectations because once leverage is cleared, XRP could stabilize or stage a sharp rebound as speculation fades. That said, retail traders appear to be leveraging the slide, as reflected in perpetual futures Open Interest (OI) rising to 2.33 billion XRP on Friday, from 2.28 billion XRP the day before. If risk-on sentiment continues to grow, a stronger tailwind could propel XRP into a short-term recovery toward resistance at $1.30.
Technical analysis: XRP falls as sellers retain trend control
XRP trades at $1.20, extending a bearish bias as price remains decisively capped beneath all key Exponential Moving Averages (EMAs) and the Bollinger Bands’ midline. The 50-day Exponential Moving Average (EMA) at $1.33, the 100-day EMA at $1.32 and the 200-day EMA at $1.36 all sit overhead, reinforcing a downside-oriented structure, while the Moving Average Convergence Divergence (MACD) indicator holds in negative territory. At the same time, the Relative Strength Index (RSI) hovers near the 35 level, hinting at persistent but not yet extreme selling pressure.
Immediate resistance is clustered just above spot at the Bollinger Bands’ lower band around $1.20, followed by the Bollinger midline near $1.29. Higher up, the 100-day EMA at $1.32 and the 50-day EMA at $1.33 define a dense technical barrier, ahead of the 200-day EMA at $1.36 and the upper Bollinger band near $1.37.
With no clear structural support identified below the current price on the daily chart, the pair would likely remain vulnerable to further downside while it fails to reclaim the $1.29-$1.33 resistance area.
(The technical analysis of this story was written with the help of an AI tool. Know more.)
Open Interest, funding rate FAQs
Higher Open Interest is associated with higher liquidity and new capital inflow to the market. This is considered the equivalent of increase in efficiency and the ongoing trend continues. When Open Interest decreases, it is considered a sign of liquidation in the market, investors are leaving and the overall demand for an asset is on a decline, fueling a bearish sentiment among investors.
Funding fees bridge the difference between spot prices and prices of futures contracts of an asset by increasing liquidation risks faced by traders. A consistently high and positive funding rate implies there is a bullish sentiment among market participants and there is an expectation of a price hike. A consistently negative funding rate for an asset implies a bearish sentiment, indicating that traders expect the cryptocurrency’s price to fall and a bearish trend reversal is likely to occur.