Pi Network Price Forecast: Post-US midterm elections market sell-off weighs on PI



- Pi Network hovers around $0.0750 on Friday, extending its prevailing downtrend capped by a long-term resistance trendline.
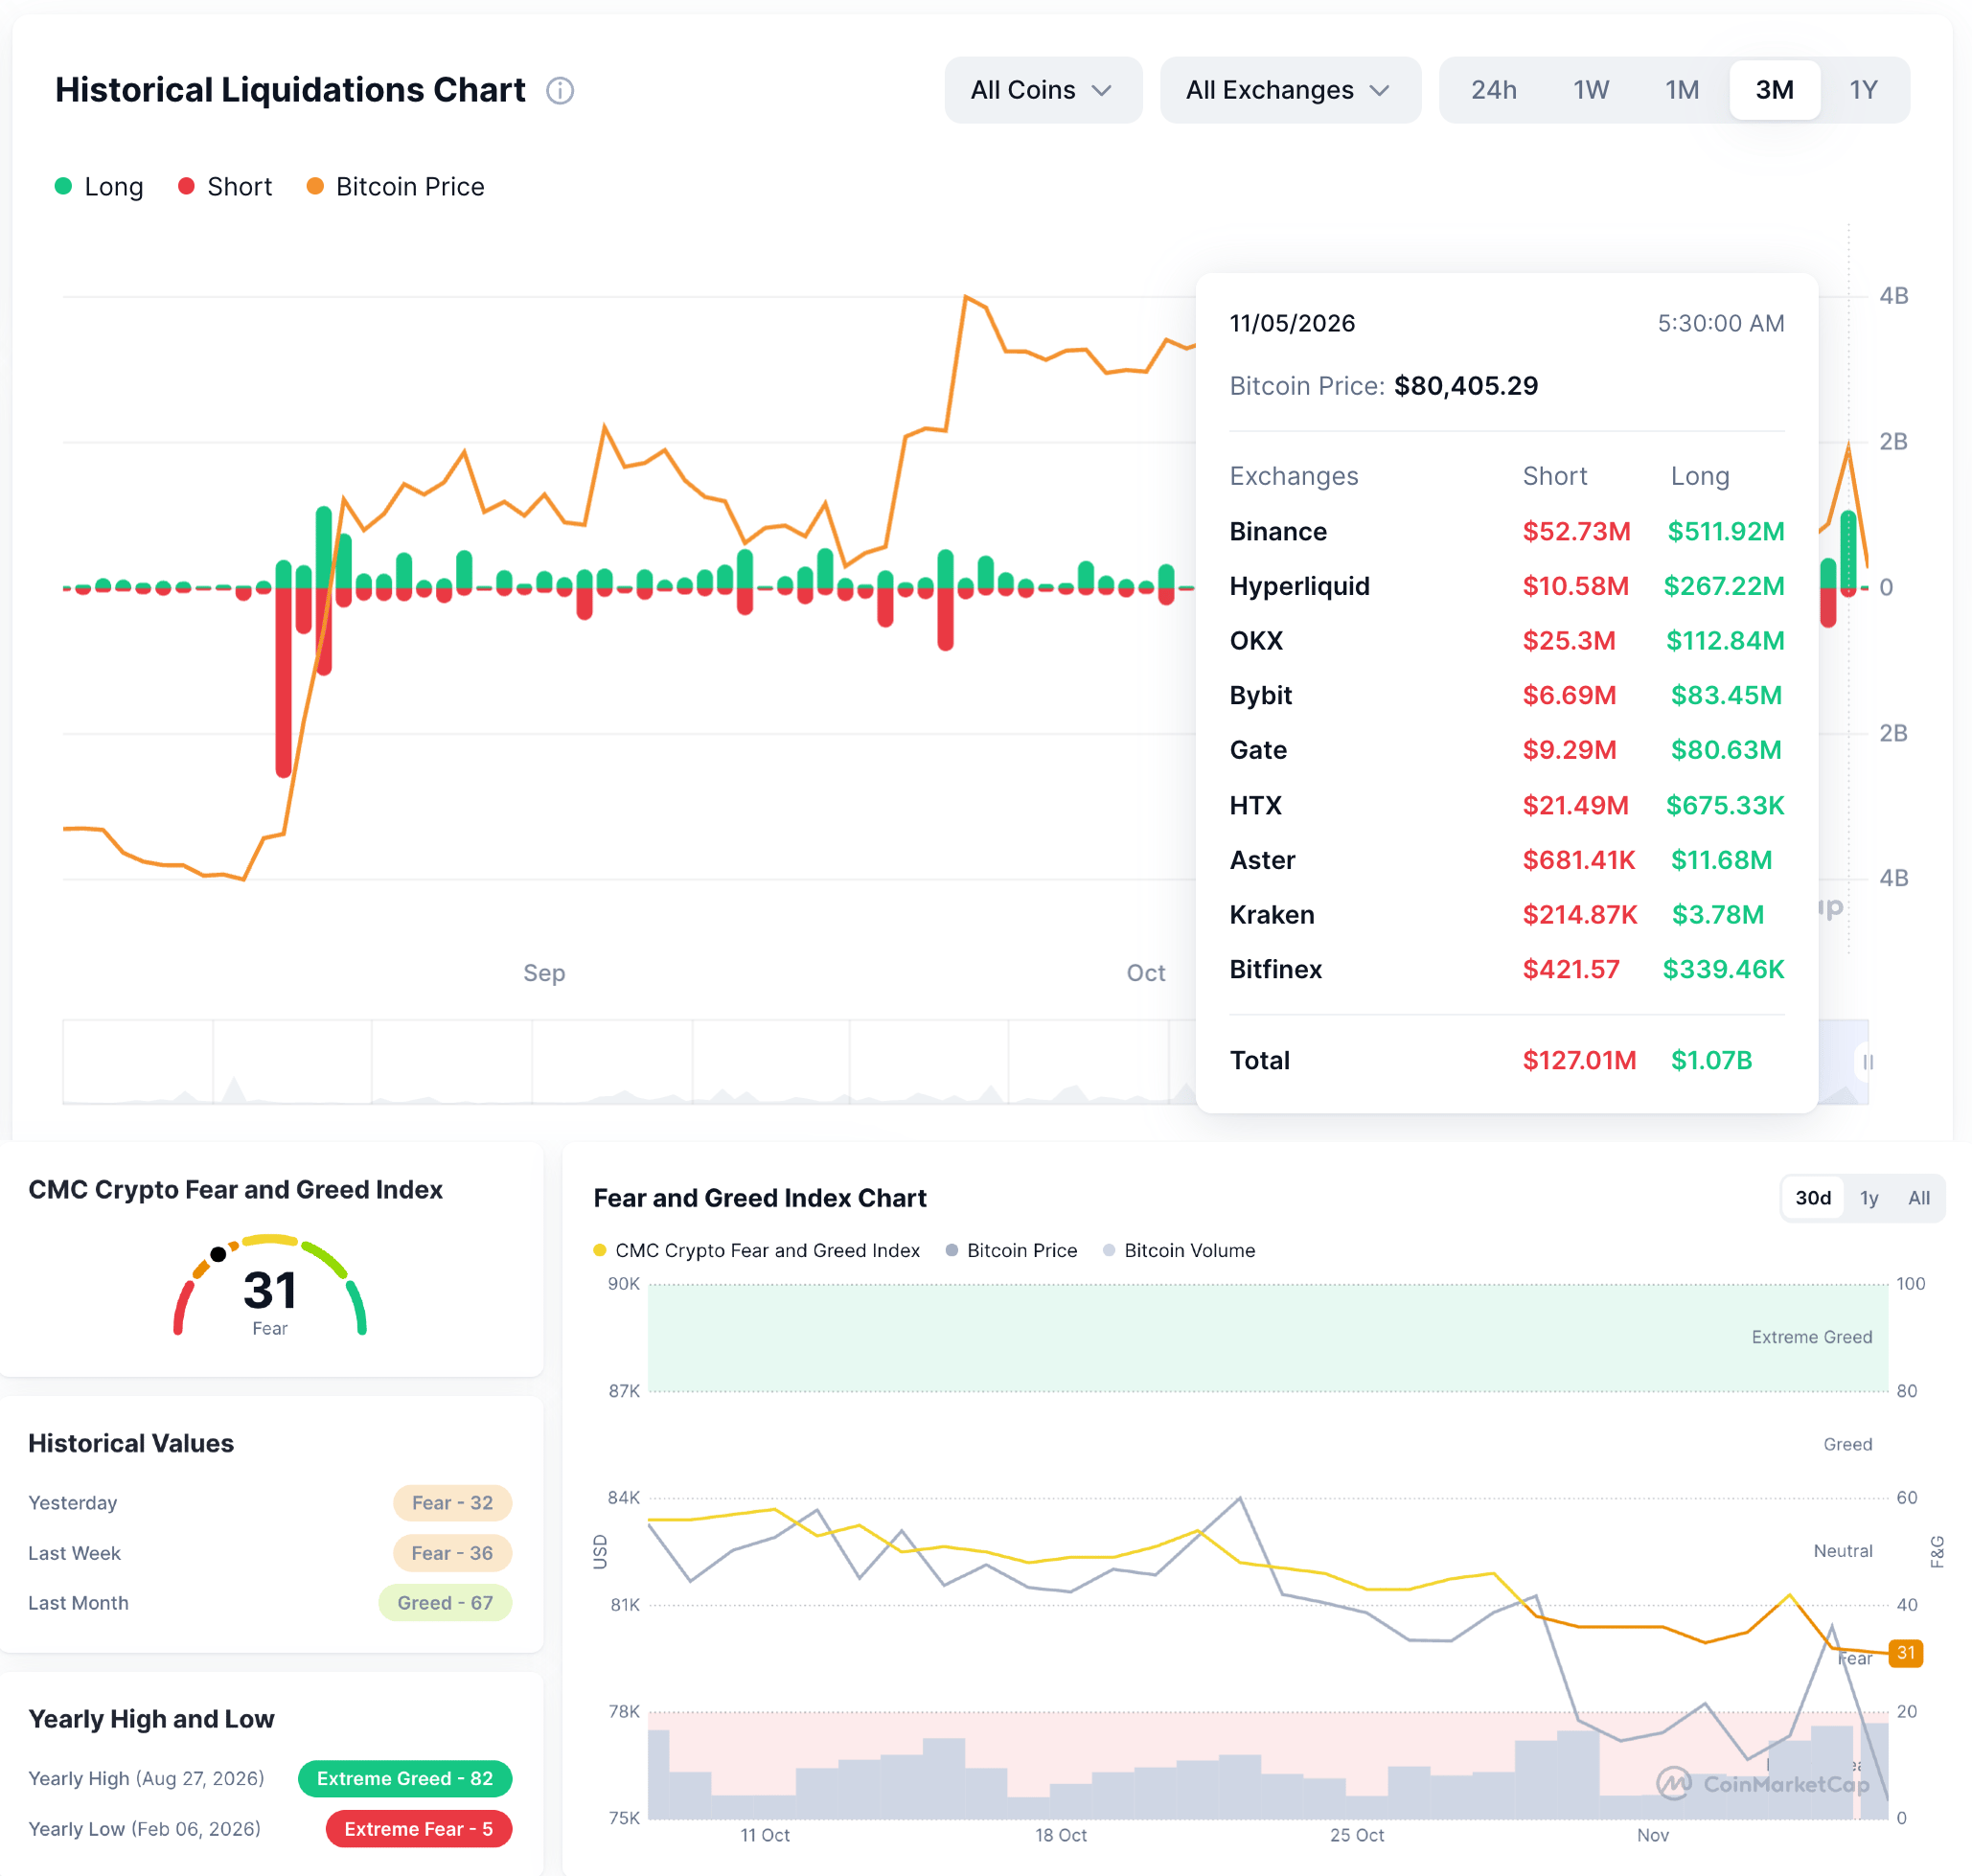
- Total crypto market long liquidations exceeded $1 billion on Thursday as the post-election rally reversed amid a broader risk-off sell-off.
- The technical outlook for PI remains bearish, with selling pressure persisting.
Pi Network (PI) continues to attract sellers, as the post-US midterm results triggered a sell-off in the US tech stock market and also wiped out over $1 billion from the crypto market. The declining trend in PI token risks forming a lower leg below its record low of $0.0704, with persistent selling pressure and faltering crypto market sentiment.
Post-US midterms weigh on the crypto market
The cryptocurrency market took a nosedive on Thursday, bleeding over $1 billion in long liquidations amid concerns that Democrats controlling the US Senate and House of Congress could lead to tighter crypto and AI regulations, as previously reported by FXStreet. In addition, CoinMarketCap’s Fear and Greed Index dropped to 31 on Friday, from 36 last week, suggesting persistent risk-off sentiment with a brief recovery on Tuesday, the day of midterm results.
Typically, broader market uncertainty weighs down high-risk crypto assets, similar to PI. Investors looking for a relief rally might have to wait for political clarity in the US.
Technical outlook: Will PI defend its final support?
Pi Network trades around $0.0756 at press time on Friday, keeping a bearish near-term tone. PI sits well below the 50-day and 200-day Exponential Moving Averages (EMAs) at roughly $0.0817 and $0.1101, respectively.
The Moving Average Convergence Divergence (MACD) risks crossing below its signal line as the positive histogram wanes, while the Relative Strength Index (RSI) hovers near 37, hinting at fragile momentum and a move toward oversold levels.
Looking down, the only nearby structural support is the October 15 low at $0.0740, followed by the record low of $0.0704 set on July 14, where buyers may look to defend the current range if selling pressure resumes.
On the topside, initial resistance appears near the trendline break area around $0.0770, followed by the 50-day EMA at $0.0817. Higher up, additional barriers are seen at the 50% retracement level around $0.1049, measured from $0.1394 to $0.0704, and the 200-day EMA at $0.1101.
(The technical analysis of this story was written with the help of an AI tool. Know more.)