

Official Trump Price Prediction 2025-2031: Will $TRUMP Price Hit $50?

Key takeaways:
- Official Trump price prediction for the end of 2025 suggests a maximum value of $10.67.
- By 2028, $TRUMP could reach a maximum price of $28.45.
- In 2031, $TRUMP will range between $34.14 to $46.22.
The Official Trump coin ($TRUMP) was launched on January 17, 2025, just three days before the inauguration of U.S. President Donald Trump. Following President Trump’s “newfound” crypto inclination, the $TRUMP meme coin was birthed.
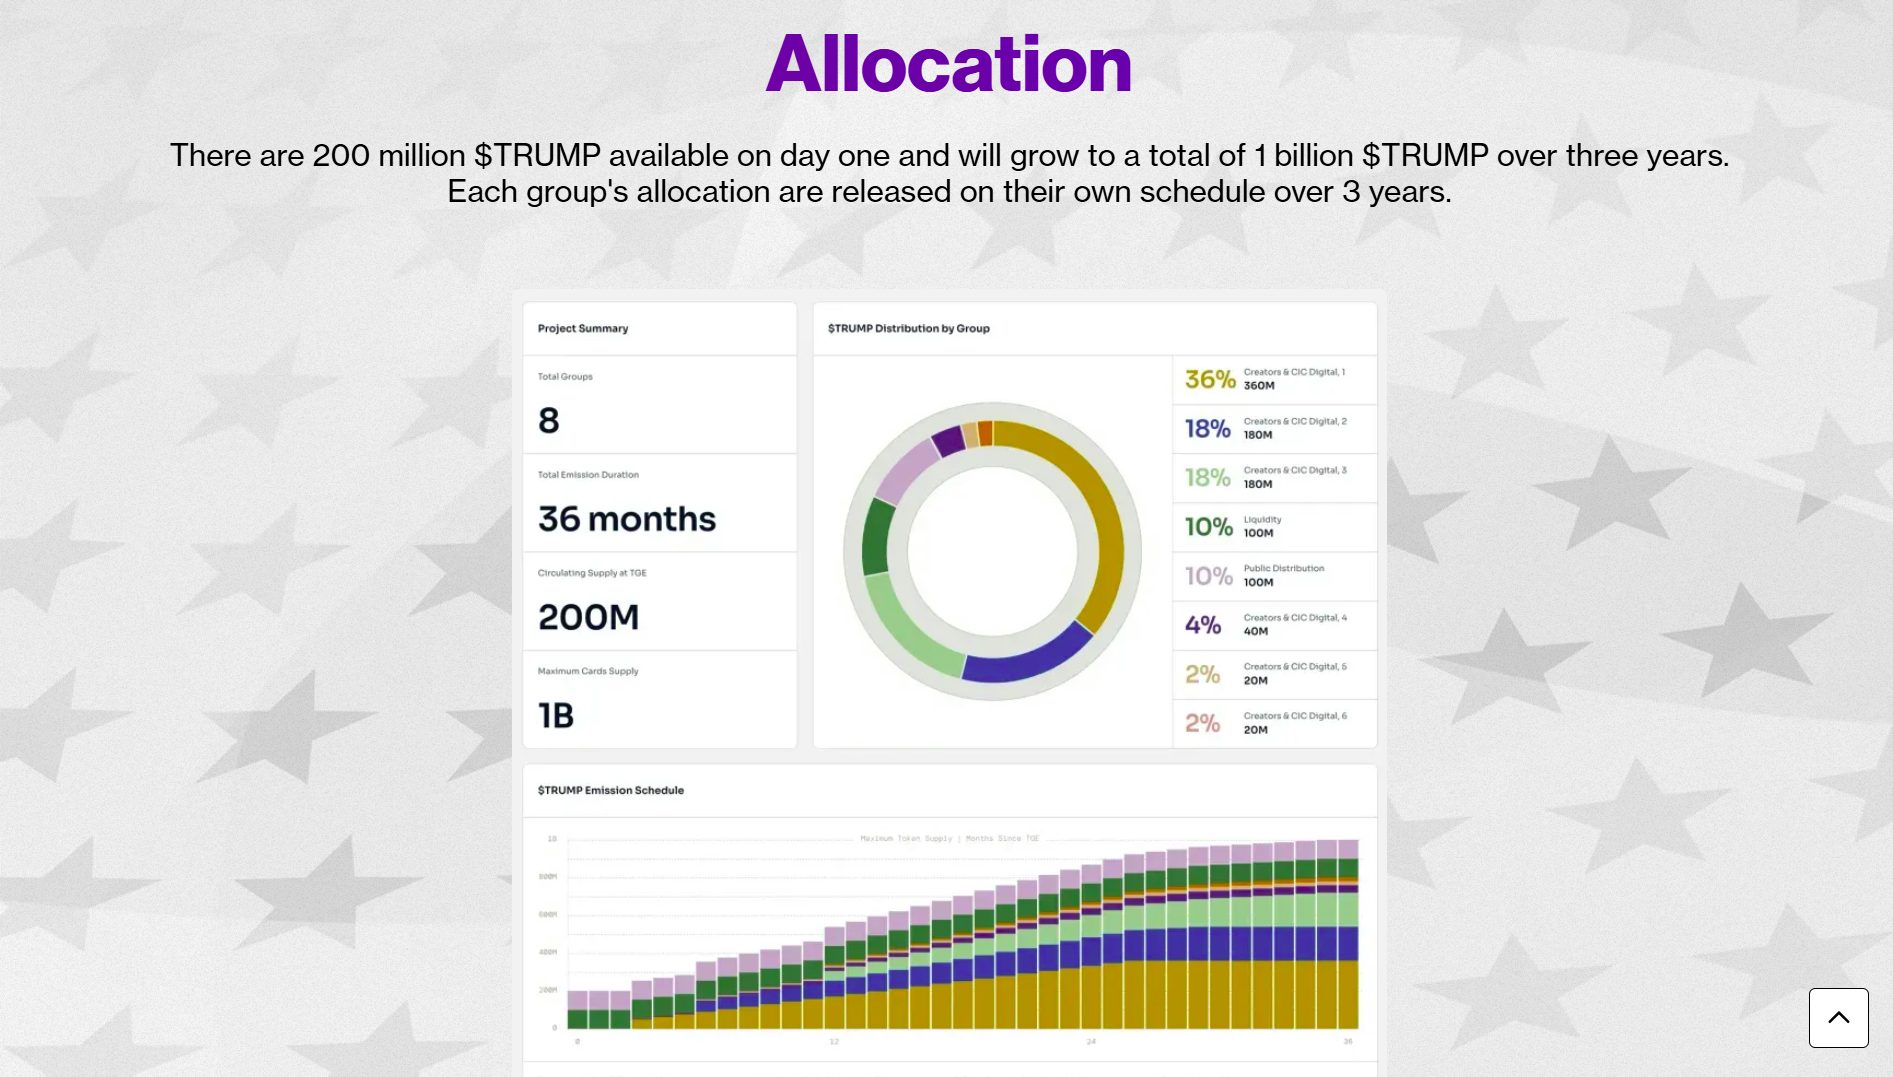
The coin has a total supply of 1 Billion tokens, with an initial 200 million tokens unlocked at launch. Subsequent unlocks are scheduled over the next three (3) years.
Trump’s “advocacy” for digital assets reforms boosted interest in $TRUMP in the first few days, driving it to an all-time high (ATH) of $75.35. Several other meme tokens, like the Official MELANIA coin, also rode the momentum. Despite the initial surge, Official Trump’s value has plunged to lower levels amidst shifting market sentiment and uproar around the legitimacy of a “President-owned Meme coin.”
The price performance of Official Trump is down over 85% from its all-time high, raising questions among investors, such as: How much will Trump coin be worth? Can Trump coin reach $100?
This piece explores the Official Trump price predictions for 2025-2031.
Overview
| Cryptocurrency | Official Trump |
| Token | $TRUMP |
| Price | $5.87 |
| Market Capitalization | $1.185B |
| Trading Volume | $374.95M |
| Circulating Supply | 199.99M TRUMP |
| All-time High | $75.35 (January 19, 2025) |
| All-time Low | $1.21 (January 18, 2025) |
| 24-h High | $6.13 |
| 24-h Low | $5.84 |
Official Trump technical analysis
| Metric | Value |
| Volatility | 11.24% (Very High) |
| 14-Day RSI | 35.79 (Neutral) |
| 50-Day SMA | $7.75 |
| Sentiment | Bearish |
| Fear & Greed Index | 34 (Fear) |
| Green Days | 15/30 (50%) |
| 200-Day SMA | $9.88 |
Official Trump Coin ($TRUMP) price analysis
TL;DR Breakdown
- TRUMP consolidates near $5.86 after heavy selling, with weakening bearish momentum.
- The coin’s resistance stands at $6.70, while $5.00 is the critical support level.
- Short-term rangebound action is likely between $5.60 and $6.20 until volume returns.
Official Trump coin 1-day price analysis
On the 1-day chart for October 21, TRUMP coin is trading around $5.86, down 1.89% for the day, holding slightly above the lower Bollinger Band at $4.89 while facing overhead resistance near the mid-band at $6.68. The Bollinger Bands remain wide, signaling persistent volatility, but the narrowing of recent candles hints that the sharp sell-off may be stabilizing.

The MACD remains negative, though histogram bars have begun to flatten, suggesting that bearish momentum is slowing. Despite this, the price continues to hover under key resistance, and any failure to close above $6.00 could see sellers regain control toward the $5.00 and $4.89 support levels.
Conversely, a bullish candle breaking and closing above $6.70 could open the path toward $7.20–$7.50. Volume activity has been modest, showing a lack of strong conviction from either side. Until a breakout forms, the coin is likely to oscillate within this tight range.
Official Trump 4-hour price analysis
The 4-hour chart reveals that TRUMP has faced repeated rejections around the $6.05 zone, forming a series of wicks that reflect indecision and selling pressure. The Alligator lines are converging tightly, showing a lack of directional strength, consistent with a sideways market.

The RSI at 48.96 remains neutral, while the OBV trending downward at -273M reflects muted accumulation. This confirms that buying strength has not yet returned in volume, and price could retest $5.80–$5.60 before any rebound attempt. If bulls successfully defend $5.80, it may create a minor bounce back toward $6.00–$6.10; however, failure here risks a slide back to $5.00.
$TRUMP technical indicators: Levels and action
Daily simple moving average (SMA)
| Period | Value | Action |
|---|---|---|
| SMA 3 | $6.81 | SELL |
| SMA 5 | $6.42 | SELL |
| SMA 10 | $6.37 | SELL |
| SMA 21 | $7.00 | SELL |
| SMA 50 | $7.75 | SELL |
| SMA 100 | $8.58 | SELL |
| SMA 200 | $9.88 | SELL |
Daily exponential moving average (EMA)
| Period | Value | Action |
|---|---|---|
| EMA 3 | $6.99 | SELL |
| EMA 5 | $7.39 | SELL |
| EMA 10 | $7.87 | SELL |
| EMA 21 | $8.30 | SELL |
| EMA 50 | $8.85 | SELL |
| EMA 100 | $9.58 | SELL |
| EMA 200 | $10.75 | SELL |
What to expect from $TRUMP price analysis
TRUMP’s current structure shows stabilization after its decline but lacks signs of a decisive bullish reversal. Expect sideways movement between $5.60 and $6.30 in the short term, with a possible upside recovery only if volume supports a breakout above $6.70.
Is Official Trump a good investment?
Meme coins like $TRUMP are volatile and driven by hype, not fundamentals. While they can offer big rewards, they come with high risk and uncertainty. If you’re making an investment decision on TRUMP coin, do your own research carefully and prepare for price swings.
Why is $TRUMP down?
$TRUMP plunged hard post‑launch, now rattling in a tight $5–8 consolidation over the past month as traders wait for new hype or a breakdown. With most tokens controlled by insiders, sentiment remains weak, and only fresh utility or momentum could revitalize it.

Will Official Trump reach $50 soon?
$TRUMP coin already saw this price point in January; increased investor interest could result in a quick resurgence.
Will Official Trump reach $100?
Having touched a peak price of $75.35 and a market cap of $15 billion in its first few weeks, the $100 milestone might not be much of a hurdle to scale, provided $TRUMP can recapture the momentum it had in its earlier days.
Will $TRUMP reach $1000?
For $TRUMP to hit $1,000, its market cap would need to rise over 100× into the hundreds of billions, or even trillions if locked supply is released. With dilution risks, weak fundamentals, regulation, and competition, the chance of this happening in the next few years is very low.”
Does Official Trump have a good long-term future?
The long-term future of the Official Trump Coin is uncertain. While it has gained attention, peaked at $75, and generated significant revenue, its success will depend on crypto market trends, investor confidence, and how it navigates regulatory challenges.
Recent news/opinion on $TRUMP
As reported by Cryptopolitan, Trump-backed World Liberty Financial (WLFI) confirmed during the Korea Blockchain Week 2025 event that the company will soon launch a debit card with Apple Pay integration. The card will be linked to its USD1 stablecoin and integrated with an application focused on retail use cases to tap into consumer payments.

Official Trump price prediction October 2025
In October 2025, $TRUMP (Official Trump) is expected to see a price range with a minimum of $4.68, an average of $6.52, and a maximum of $8.20.
| Month | Minimum price | Average price | Maximum price |
| $TRUMP price prediction October 2025 | $4.68 | $6.52 | $8.20 |
Official Trump price prediction 2025
For the remainder of 2025, $TRUMP’s price is projected to range between a minimum of $5.02 and a maximum of $10.67, with an average estimate of $8.89.
| Year | Minimum price | Average price | Maximum price |
| Official Trump price prediction 2025 | $5.02 | $8.89 | $10.67 |
Official Trump price predictions 2026 – 2031
| Year | Minimum Price ($) | Average Price ($) | Maximum Price ($) |
| 2026 | 10.43 | 13.34 | 16.59 |
| 2027 | 15.17 | 18.67 | 22.52 |
| 2028 | 19.91 | 24.00 | 28.45 |
| 2029 | 24.66 | 29.33 | 34.37 |
| 2030 | 29.39 | 34.67 | 40.30 |
| 2031 | 34.14 | 40.01 | 46.22 |
Official Trump forecast 2026
In 2026, analysts suggest a maximum price of $16.59 for $TRUMP. Traders and investors can anticipate an average price of $13.34 and a minimum price of $10.43.
Official Trump price forecast 2027
Projections suggest that in 2027, the Official Trump ($TRUMP) coin could peak at $22.52, with a minimum forecasted at $15.17 and an average of around $18.67.
Official Trump coin price prediction 2028
In 2028, $TRUMP could potentially reach a high of $28.45, with a projected low of around $19.91 and an average trading price of approximately $24.00.
Official Trump price prediction 2029
The 2029 forecast indicates that $TRUMP could reach up to $34.37, with an average price forecasted at $29.33 and a minimum expected around $24.66.
Official Trump price prediction 2030
In 2030, $TRUMP is expected to fluctuate between $36.74 and $40.30, with an average projected price of $38.52.
Official Trump $TRUMP price prediction 2031
Projections indicate that the price of $TRUMP could potentially reach a peak of $46.22 by 2031, with a projected minimum of around $42.67 and an average of approximately $44.45.

Official TRUMP market price prediction: Analysts’ $TRUMP price forecast
| Firm Name | 2025 | 2026 |
| DigitalCoinPrice | $13.02 | $15.38 |
| CoinDCX | $7.70 | $10.00 |
| Coincodex | $6.02 | $12.69 |
Cryptopolitan’s Official TRUMP ($TRUMP) price prediction
Cryptopolitan’s Official TRUMP prediction showcases a gradual upward trajectory. In 2025, $TRUMP is forecasted to close the year at about $7. Subsequently, the coin is projected to maintain a trading range of $5 to $15 in 2026. By 2031, Cryptopolitan anticipates $TRUMP could peak at $45, with an average price of around $23.
Official TRUMP historic price sentiment

- Official Trump coin was launched on January 17, 2025, just a few days before the US presidential inauguration. Briefly after launch, the euphoria of DJT’s inauguration drove the $TRUMP coin to an all-time high of $75.35.
- As expected, market players took profit, and the Official Trump coin lost momentum, hitting a low of $18.75 by February 1, a massive 75% drop in price. Further price declines followed, but $TRUMP showed some resilience, reaching a high of $24 by mid-February, albeit short-lived.
- The bears recaptured the market in the following months, and the Official Trump coin settled at lower prices – about $7 to $11 between March and April. $TRUMP hit a high of $16.28 by April end, but has since maintained an average price of about $10.5.
- Official Trump coin traded between $8.07 and $10.13 in August. In September, TRUMP maintained a trading range of $7.37-$9.46, and in October, it’s trading between $5.84-$6.13.
บทความแนะนำ


ความคิดเห็น (0)
คลิกปุ่ม $ ป้อนสัญลักษณ์ และเลือกเพื่อเชื่อมโยงหุ้น, กองทุน ETF หรือสัญลักษณ์หลักทรัพย์อื่น ๆ