Will the U.S. Enter a Recession in 2026? Here's What the Data Suggests.

Key Points
Rising oil prices are straining the economy, with leading economists raising the odds of a recession.
Multiple stock market metrics also suggest a pullback could be on the way.
However, there are two major silver linings for investors.
Recession fears are back, and stock prices continue to slide. The S&P 500 (SNPINDEX: ^GSPC) is down more than 6% over the past month alone, and the tech-heavy Nasdaq Composite (NASDAQINDEX: ^IXIC) just entered correction territory by falling 10% from its peak earlier this year.
Perhaps the worst part of all of this volatility, however, is the uncertainty it's causing. Will the economy worsen? Will the market crash? How long will it take for it to recover? While it's impossible to answer these questions with any certainty right now, here's what the data suggests about the future.
Will AI create the world's first trillionaire? Our team just released a report on the one little-known company, called an "Indispensable Monopoly" providing the critical technology Nvidia and Intel both need. Continue »

Image source: Getty Images.
History suggests investors should be careful
Economists have varying opinions on whether a recession may be looming. Goldman Sachs, for example, recently forecast a 30% chance that the U.S. will enter a recession in the next 12 months, up from its earlier 25% prediction.
Moody's, on the other hand, is less optimistic. Its forecasting model predicts 49% odds that a U.S. recession will begin in the next year, noting that it could surpass 50% if oil prices continue to surge.
Even before the war in Iran, multiple stock market metrics have suggested the market is overvalued and perhaps due for a pullback. The S&P 500 Shiller CAPE Ratio, for instance, has been steadily inching toward a new all-time high.
This ratio measures the S&P 500's price against its inflation-adjusted earnings over the past 10 years, and a higher ratio suggests that the index is overvalued. Its long-term average sits at around 17, and it peaked in late 1999, when it reached 44. As of this writing, the ratio is close to 40 -- the second-highest it's ever been.
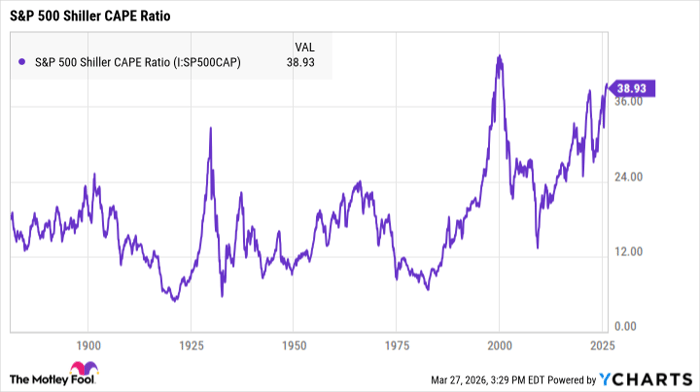
S&P 500 Shiller CAPE Ratio data by YCharts
The Buffett indicator is another metric to consider. Popularized by Warren Buffett in the early 2000s, it measures the relationship between the total market cap of all U.S. stocks and U.S. GDP. Like the Shiller CAPE Ratio, higher figures suggest that the market could be overvalued.
Buffett explained in a 2001 interview with Fortune magazine that the ideal time to buy stocks is when the ratio is around 70% to 80%. He noted, too, that if the ratio nears 200%, investors are "playing with fire."
The Buffett indicator has been steadily climbing since the end of the Great Recession. It peaked at around 193% in late 2021, just before the major indexes entered a bear market that would last most of the following year. Now, as of March 2026, it sits at around 213%.
What should investors do right now?
From market indicators suggesting the market is overvalued to economists sharing recession warnings, investors are inundated with bad news. But there are two silver linings to remember.
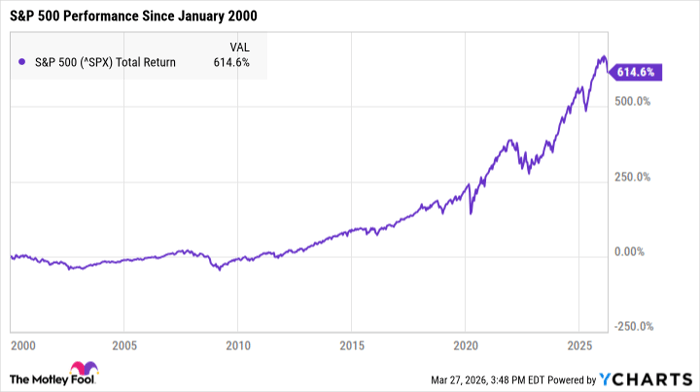
For one, the market's long-term future is incredibly bright, no matter what happens this year. In the last two decades alone, stocks have survived everything from the dot-com implosion and collapse of the tech sector to the Great Recession to the COVID-19 pandemic -- along with plenty of economic and political uncertainty in between.
Even if we do face a recession in 2026 -- which still isn't guaranteed -- the market will pull through with enough time. Although very little is ever certain when investing, history shows that the overall stock market has a 100% success rate of recovering from recessions, crashes, and bear markets.
The other silver lining is that stocks are often far more affordable during recessions and bear markets. Surging stock prices make the market prohibitively expensive for many investors, and if stocks tumble, it can create an opportunity to load up on normally high-priced investments at steep discounts.
This isn't to say a recession is necessarily a good thing, of course, but it can be a smart time to invest more. Then, when the market inevitably recovers, your portfolio will be set up for potentially lucrative long-term gains.
Where to invest $1,000 right now
When our analyst team has a stock tip, it can pay to listen. After all, Stock Advisor’s total average return is 884%* — a market-crushing outperformance compared to 179% for the S&P 500.
They just revealed what they believe are the 10 best stocks for investors to buy right now, available when you join Stock Advisor.
*Stock Advisor returns as of March 29, 2026.
Katie Brockman has no position in any of the stocks mentioned. The Motley Fool has no position in any of the stocks mentioned. The Motley Fool has a disclosure policy.