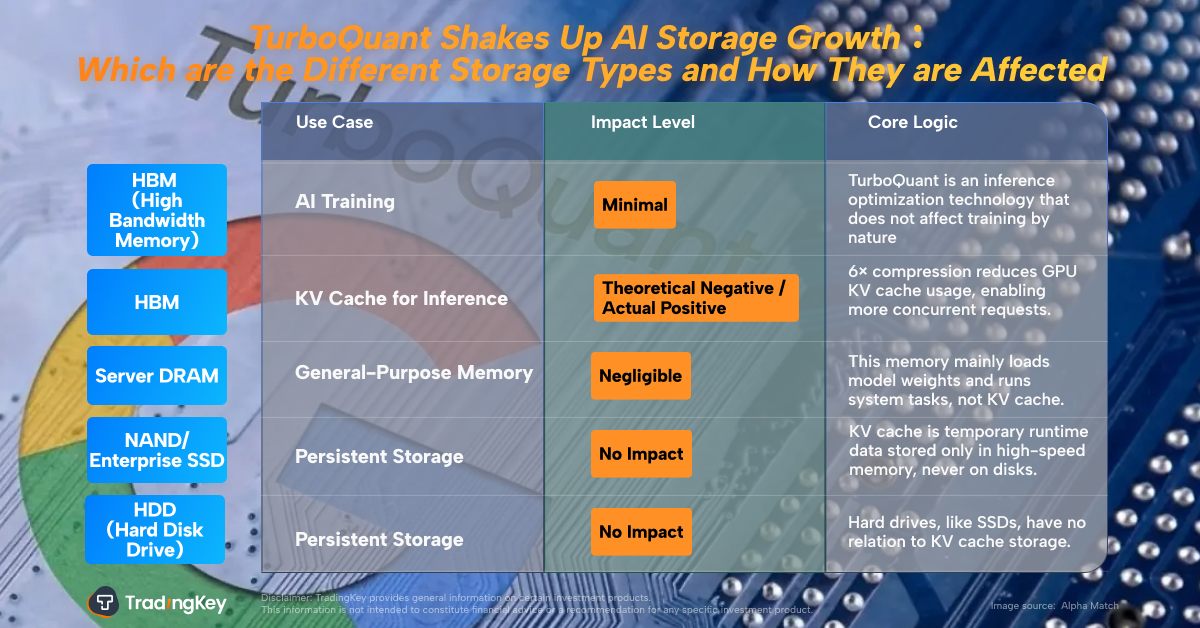
SCHD vs NOBL: Which ETF is the Best Buy for Your Dividend Goals?

Key Points
SCHD charges a much lower fee and delivers a higher dividend yield than NOBL.
NOBL tilts more toward consumer defensive and industrials, while SCHD leans heavily on energy and healthcare.
While one ETF focuses on yield, the other is oriented towards dividend growth
Both the Schwab U.S. Dividend Equity ETF (NYSEMKT:SCHD) and the ProShares S&P 500 Dividend Aristocrats ETF (NYSEMKT:NOBL) target dividend-focused U.S. equities, but SCHD stands out for its lower cost and higher yield, while NOBL offers a more diversified sector mix.
The ETFs take distinct approaches: SCHD tracks the Dow Jones U.S. Dividend 100 Index, whereas NOBL invests at least 80% of its total assets in component securities of its index, with a minimum of 40 equally weighted stocks and no single sector comprising more than 30% of index weight.
Snapshot (cost & size)
| Metric | SCHD | NOBL |
|---|---|---|
| Issuer | Schwab | ProShares |
| Expense ratio | 0.06% | 0.35% |
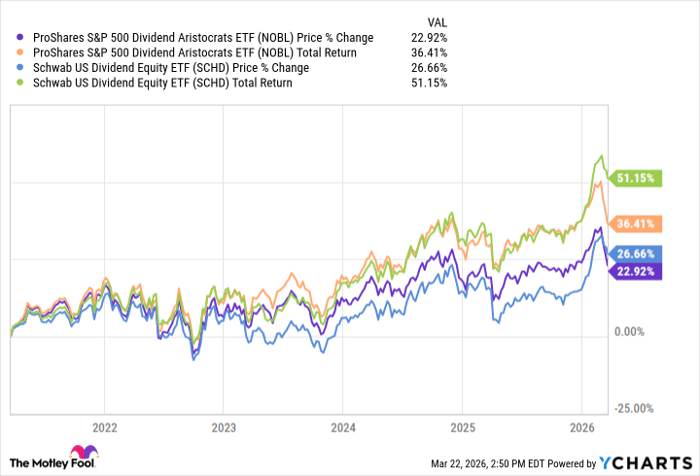
| 1-yr total return (as of 2026-03-21) | 13.8% | 5.7% |
| Dividend yield | 3.5% | 2% |
| Beta | 0.65 | 0.76 |
| AUM | $98.2 billion | $10.9 billion |
Beta measures price volatility relative to the S&P 500; beta is calculated from five-year monthly returns. The 1-yr return represents total return over the trailing 12 months.
SCHD comes in as the more affordable option, charging just 0.06% annually versus NOBL’s 0.35%. SCHD also delivers a higher dividend yield, which may appeal to income-focused investors looking for a stronger payout.
Performance & risk comparison
| Metric | SCHD | NOBL |
|---|---|---|
| Max drawdown (5 y) | -16.82% | -17.91% |
| Growth of $1,000 over 5 years | $1,267 | $1,229 |
What's inside
NOBL holds around 70 stocks, with no single sector allowed to exceed 30% of the portfolio. The fund’s largest sector exposures are industrials (22.5%), consumer defensive (22.09%), and financial services (13.08%). Top holdings as of March 20 include Chevron (NYSE:CVX), ExxonMobil (NYSE:XOM), and Linde (NASDAQ:LIN), each making up less than 2% of assets. The fund has a 12.4-year track record. This equally weighted approach aims to reduce concentration risk and maintain broad exposure to established dividend growers.
In contrast, SCHD holds 101 names, leaning more heavily on energy (19.88%), consumer defensive (18.5%), and healthcare (16.2%). Its largest positions are ConocoPhillips (NYSE:COP), Lockheed Martin Corp (NYSE:LMT), and Chevron, each at around 4.8%–5% of assets, creating a more top-heavy profile. Both funds avoid leverage, currency hedging, and other structural quirks.
For more guidance on ETF investing, check out the full guide at this link.
What this means for investors
The Schwab U.S. Dividend Equity ETF offers a much higher dividend yield than the ProShares S&P 500 Dividend Aristocrats ETF. That’s because SCHD is yield-oriented, investing in stocks offering high yields. However, the fund’s underlying index, the Dow Jones U.S. Dividend 100™ Index, ensures that its companies have a strong dividend track record and selects its constituents using financial ratios. That means only high-quality companies make it to the ETF.
NOBL, on the other hand, focuses on dividend growth instead of yields, investing only in Dividend Aristocrats®. The term Dividend Aristocrats® is a registered trademark of Standard & Poor’s Financial Services LLC, a subsidiary of the S&P 500 Global (NYSE:SPGI). It is an elite group of S&P 500 companies that have raised their dividends for at least 25 consecutive years. These are established companies in their respective industries with strong financials that can support regular, growing dividends.
The combination of a higher yield with significantly lower fees (expense ratio) makes SCHD a superior dividend ETF to own. NOBL, however, is a better fit for investors seeking dividend stability, as its constituents have a long track record of dividend raises.
Should you buy stock in ProShares S&P 500 Dividend Aristocrats ETF right now?
Before you buy stock in ProShares S&P 500 Dividend Aristocrats ETF, consider this:
The Motley Fool Stock Advisor analyst team just identified what they believe are the 10 best stocks for investors to buy now… and ProShares S&P 500 Dividend Aristocrats ETF wasn’t one of them. The 10 stocks that made the cut could produce monster returns in the coming years.
Consider when Netflix made this list on December 17, 2004... if you invested $1,000 at the time of our recommendation, you’d have $495,179!* Or when Nvidia made this list on April 15, 2005... if you invested $1,000 at the time of our recommendation, you’d have $1,058,743!*
Now, it’s worth noting Stock Advisor’s total average return is 898% — a market-crushing outperformance compared to 183% for the S&P 500. Don't miss the latest top 10 list, available with Stock Advisor, and join an investing community built by individual investors for individual investors.
*Stock Advisor returns as of March 23, 2026.
Neha Chamaria has no position in any of the stocks mentioned. The Motley Fool has positions in and recommends Chevron, ProShares S&P 500 Dividend Aristocrats ETF, and S&P Global. The Motley Fool recommends ConocoPhillips, Linde, and Lockheed Martin. The Motley Fool has a disclosure policy.